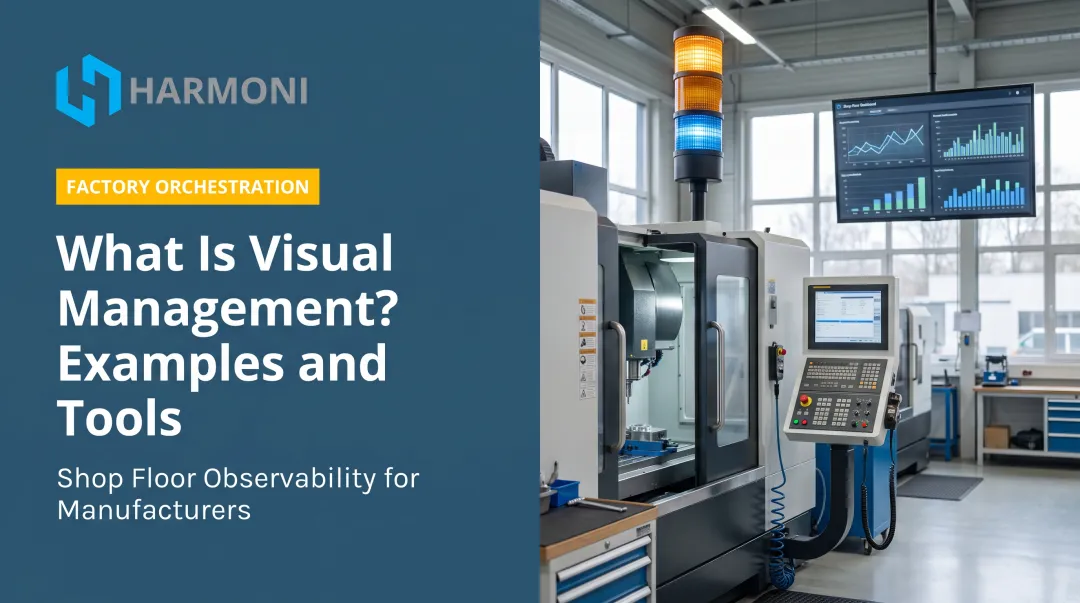
Now picture the opposite: a floor where the status of every machine, job, and safety zone is obvious within seconds of walking in. That's a visual factory.
The Lean Enterprise Institute defines visual management as placing tools, parts, production activities, and performance indicators in plain view. In practice, it means making problems, abnormalities, and standards visible to everyone, not just the people who ask.
The goal is a factory that speaks for itself, cutting reliance on verbal instructions and after-the-fact reports. Below, we'll cover why this matters, the tools that make it work, and a four-step plan for rolling one out.
Key Takeaways
- Visual tools communicate safety, quality, and production status at a glance
- Well-run visual factories cut errors, sharpen accountability, and speed up problem-solving
- Rolling one out works best in four phases: assess, plan, implement, sustain
- Digital platforms now layer real-time, contextualized data over static signs and boards
Why a Visual Factory Is Non-Negotiable: The Core Benefits
A visual factory isn't a nice-to-have for tidy shops. It solves problems that cost real money every shift, from missed handoffs to quality drift nobody catches until it's too late.
Reduces production errors and improves quality. Defects are expensive. NIST estimates that defects cost U.S. discrete manufacturers between $32.0 billion and $58.6 billion annually, covering scrap, rework, and failure analysis. Clear work instructions, posted quality standards, and color-coded tooling at the point of use catch mistakes before they become scrap.
Harmoni's digital checksheets push scrap and quality data straight into ERP systems like Epicor or JobBoss, so a bad part gets flagged the moment it's found, not during a month-end review.
Quality issues aren't the only costly risk on the floor. Enhances safety and compliance. OSHA requires marked aisles and appropriately labeled hazard signage in areas with material handling equipment. Floor tape, safety zones, and equipment status lights make those requirements visible daily instead of relying on a binder nobody reads.
Safety visibility protects people, but daily performance still depends on whether operators know where they stand. Increases accountability and empowers operators. A live dashboard showing progress versus target lets a team see, mid-shift, whether they're winning or losing. No supervisor needed to interpret it.
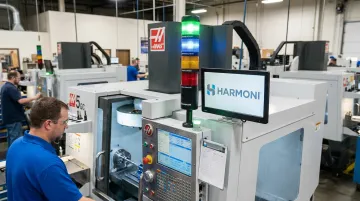
Harmoni's status lights work on that same principle at MSI. The lights give managers real-time visibility into machine and operator activity without manual check-ins, and reportedly helped the shop nearly eliminate part-count errors on complex, high-risk jobs.
The common thread across all three benefits:
- Fewer defects mean less cost of poor quality
- Visible compliance reduces reliance on memory or paperwork
- Real-time targets let teams self-correct without waiting on a supervisor
The Building Blocks: Key Components of a Visual Factory
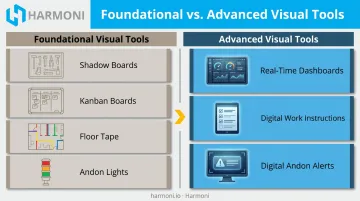
Visual factory tools generally fall into two categories: foundational tools that are physical and static, and advanced tools that are digital and dynamic. Most shops need both.
Foundational Visual Tools (Low-Tech, High-Impact)
These are the tools most people picture first: inexpensive, durable, and effective without a power source.
- Visual displays for information sharing: Production control boards (Kanban), KPI boards, and team communication hubs post schedules, goals, and improvement ideas where everyone walks past them
- Visual controls for standardization: Shadow boards show a missing tool at a glance, color-coded lubrication points guide maintenance, and floor tape marks workflow paths, WIP staging, and safe walkways
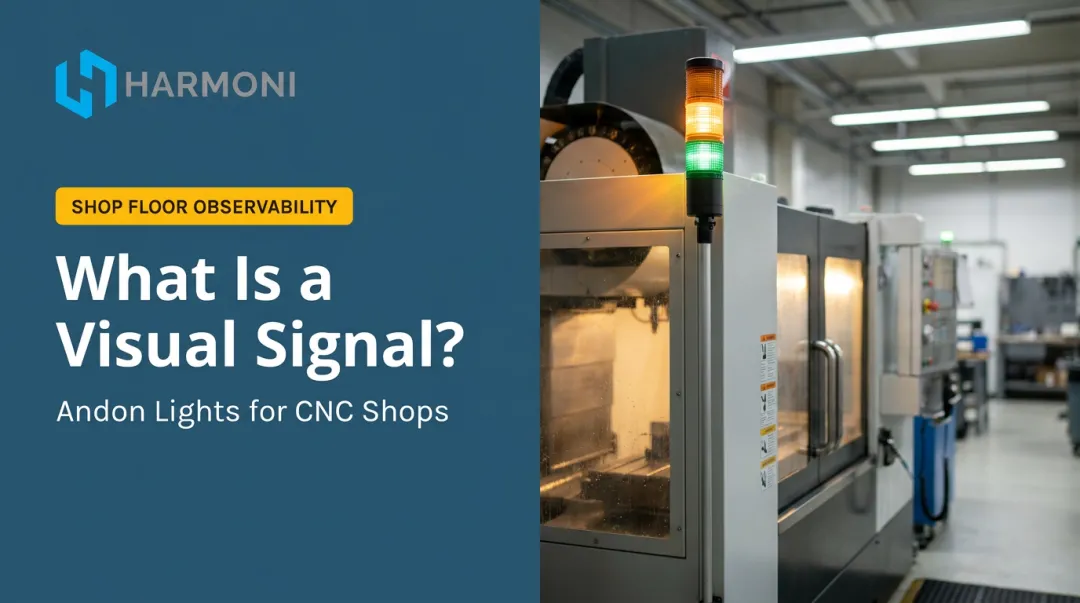
- Visual alerts for problem identification: Andon lights signal red, yellow, or green status so a stoppage, quality issue, or material shortage gets attention immediately instead of on the next scheduled walk-through
Advanced Visual Tools (Digital and Dynamic)
Static boards work fine until information changes faster than someone can update a whiteboard. That's where digital tools take over.
- Real-time dashboards and scoreboards: Large screens display live OEE, production counts, takt time, and downtime reasons, updated automatically instead of manually at shift change
- Digital work instructions: Tablets or screens at the workstation deliver step-by-step guides with images and video, far easier to follow and update than a printed binder
- Digital andon and escalation alerts: Machine-side signals flag downtime, quality holds, or material shortages the moment they happen, routing the alert to a supervisor instead of waiting for a floor walk
The gap between the two matters more than it might seem. McKinsey reports that Jabil implemented digital work instructions and saw more than a 10% increase in production yield within four weeks. It's a single case rather than an industry average, but the jump shows what's achievable.
Harmoni's own digital work instructions go a step further: they're linked directly to part revisions, so when engineering changes a print, the operator at the machine automatically receives the current version. No outdated copy sitting on a shelf.
Your 4-Step Guide to Implementing a Visual Factory
Treat this as a phased rollout, not a weekend project. Shops that try to visualize everything at once usually end up with clutter and boards nobody trusts. Start small, prove the value, then scale.
Step 1: Assess and Identify Information Gaps
Walk the actual floor, known as a Gemba walk, and watch where communication breaks down instead of guessing from the office. Ask operators directly:
- "What information do you waste time looking for?"
- "How do you know if you're winning or losing during your shift?"
- "What's the most common mistake made at this station, and why?"
Their answers point straight to your first project.
Step 2: Plan Your Visual Strategy
Prioritize gaps tied to safety, quality, and your primary production constraint first. Not every idea from the Gemba walk deserves equal attention. Then match the tool to the problem:
- Floor tape for workflow and WIP boundaries
- A digital dashboard for real-time KPIs
- A shadow board for critical, easy-to-lose tools
Platforms like Harmoni pair andon-style stack lights with real-time dashboards, so KPI and alert data live in one system instead of a patchwork of spreadsheets and whiteboards. Skip the temptation to buy every gadget in the catalog; a shop drowning in signage confuses people just as much as one with none.
Step 3: Implement, Train, and Engage
With the right tools chosen, pilot in one area or one line before rolling out plant-wide. Involve the operators who'll actually use the tools in designing them; buy-in drops fast when a visual system gets imposed without input.
Follow with brief training on what each new signal means and how to react to it. This rarely needs a formal course; five minutes at a shift huddle covers most cases.
Step 4: Sustain and Continuously Improve
Build a feedback loop through short, regular check-ins that ask whether the visual tools are helping or just adding clutter. Give the team ownership of updating boards and displays themselves.
Visual factories that get built once and never touched again slowly turn into wallpaper: accurate for a month, ignored after that.
From Visibility to Orchestration: The Next Generation of Visual Factories
Static boards and even digital dashboards answer one question: what's happening right now? But visibility alone doesn't fix anything. Someone still has to notice the problem and act on it. That's the gap factory orchestration platforms are built to close.
Harmoni's platform connects people, machines, and systems instead of just displaying data at each of them separately. Rather than a dashboard limited to OEE, Harmoni combines machine data such as cycle time and run status with operator activity. It layers in ERP workflow information from systems like Epicor, Infor, or JobBoss, creating one contextualized view at each workcenter.
That combination changes what a visual factory can actually do:
- Automates non-productive tasks: RFID identifies the operator and job automatically, then loads the correct program, offsets, and work instructions without manual entry
- Guides operators through complex processes: Setup sheets and revision-controlled instructions appear already matched to the part and job at hand
- Surfaces problems in real time: Status lights and dashboards flag issues as they happen, not during a review meeting days later
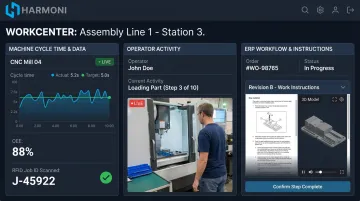
At WessDel, a precision manufacturer, Harmoni's rollout included cycle time analysis and helped the shop cut scrap by 22% in two months.
"Even operators love using it — they appreciate the automation." — Bob Dorricott, President, WessDel
That's the practical difference between a factory that's visible and one that's orchestrated. An orchestrated system removes the manual steps that cause problems, rather than just flagging them after the fact.
Frequently Asked Questions
What are the biggest challenges when implementing a visual factory?
Resistance to change tops the list, along with keeping information updated and accurate. Many shops also fall into visual clutter, with too many signs and boards competing for attention until people stop reading any of them.
How do you get buy-in from employees for a visual factory?
Involve operators in designing the tools they'll use daily, rather than imposing a system from the office. Showing how a change makes their job easier or safer wins support faster than any announcement.
How does a visual factory differ from 5S or Lean manufacturing?
A visual factory is a toolset (think red tags and floor markings) that supports 5S and the broader Lean philosophy, rather than a separate methodology. 5S creates the organized conditions that make visual control possible in the first place.
Can a visual factory be implemented in a high-mix, low-volume environment?
Yes, and it's highly effective, but the focus shifts toward dynamic tools. Digital work instructions and real-time scheduling dashboards, like those Harmoni's platform delivers, matter more than static signs since routes and jobs change constantly.
How do you measure the ROI of a visual factory?
Track the metrics it directly influences: defect rates, incident rates, downtime, and on-time delivery. Harmoni's real-time OEE dashboards make this before-and-after comparison straightforward, and improvement in those numbers after rollout is your clearest signal of return.
What is the first, most impactful visual tool a factory should implement?
A simple manual KPI board on the main production line tracking hourly progress against goals. It costs almost nothing and immediately builds a "win the shift" mentality among operators.