Introduction
Most manufacturers aren't short on data. They're short on timely data.
End-of-shift reports show what happened. Weekly summaries confirm it. But by the time a quality engineer catches a defect spike or a supervisor notices a machine running slow, the damage is already done — scrap written off, schedule slipped, job cost wrong.
That gap — between when something goes wrong and when someone finds out — is where most manufacturing losses actually happen. According to a NIST analysis of U.S. discrete manufacturing, preventable maintenance issues alone account for $18.1 billion in annual downtime losses, with facilities relying heavily on reactive approaches experiencing 3.3 times more downtime than those using proactive methods.
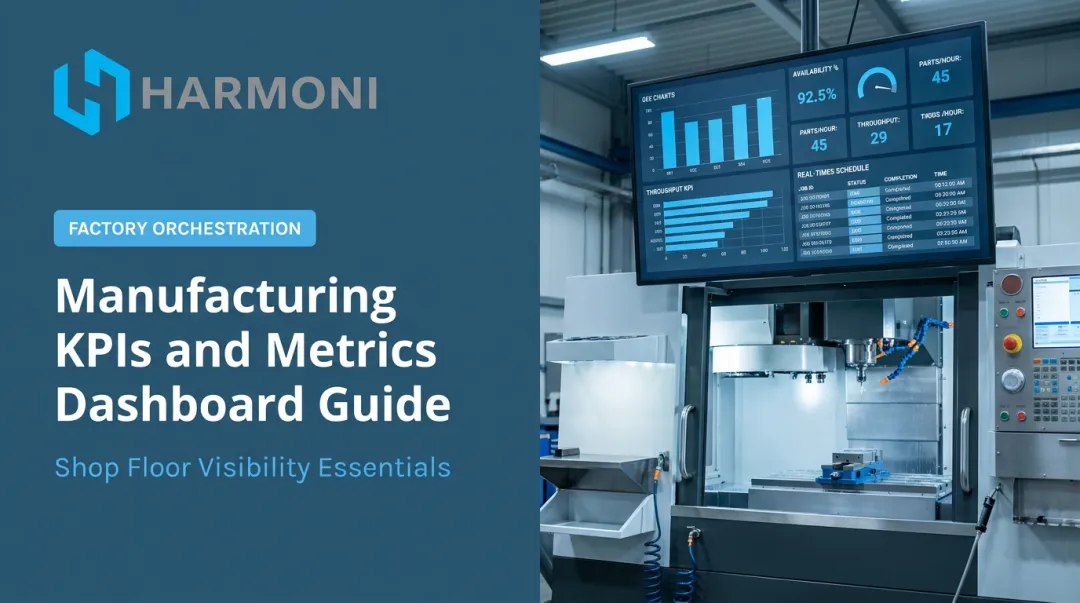
This article covers the most important real-time manufacturing KPIs, how each one is calculated, and why monitoring them live — while production is still running — gives operations teams a chance to act before losses compound.
Key Takeaways
- Real-time KPIs let teams fix problems during production, not after losses have compounded
- Critical KPI categories span equipment efficiency, quality, workforce productivity, and maintenance health
- OEE only drives improvement when tracked continuously — post-shift calculations are too late
- Capturing labor, machine, and material data in real time enables truly accurate job costing
- Unified visibility across machines, operators, and ERP data closes the blind spots that siloed systems leave open
Why Real-Time KPI Visibility Changes Manufacturing Performance
Lagging Indicators vs. Live Data
A lagging indicator tells you what already happened. End-of-shift OEE, weekly defect tallies, monthly scrap reports — these are all historical summaries. They're useful for trend analysis, but they offer zero ability to intervene.
Real-time KPIs work differently. When a machine's output rate drops mid-run, or a defect count starts climbing at hour three of a six-hour shift, live data makes those signals visible while there's still time to act. The shift hasn't ended. The batch isn't finished. There's still time to catch it.
The Cost of Delayed Visibility
A NIST study found that manufacturers using predictive and preventive approaches had an 87% lower defect rate than those relying on reactive maintenance. When a defect rate spikes mid-shift and no one notices until end-of-day reporting, scrap accumulates, delivery timelines compress, and job costing absorbs unplanned labor hours.
In precision environments — CNC machining, aerospace components, defense parts — the cascade is worse. A single out-of-spec part can mean reworked batches, compliance failures, or customer-facing quality escapes. The cost isn't just the part. It's everything downstream from it.
Why Siloed Data Creates Blind Spots
Delayed visibility is often a data structure problem, not just a timing problem. Real-time KPI monitoring only works when data from all three sources comes together:
- Machine data — spindle utilization, cycle counts, downtime events
- Operator data — who is running what, for how long, with what outcome
- ERP data — job targets, planned cycle times, material consumption
Any one of these in isolation gives an incomplete picture. Machine data without operator context can't distinguish a process problem from a staffing issue. Operator data without machine data misses mechanical slowdowns. ERP data without shop floor feeds produces job cost estimates that are structurally disconnected from what actually happened.
When all three converge in a single view, KPIs stop being reports and start being operational signals.
Equipment and Production Efficiency KPIs
Overall Equipment Effectiveness (OEE)
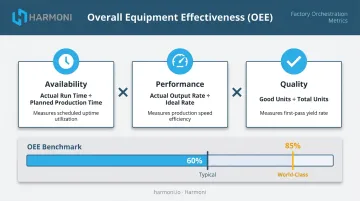
OEE is the most widely used single metric for measuring manufacturing productivity. It combines three factors into one percentage that reflects how effectively equipment is used against its full potential:
OEE = Availability × Performance × Quality
- Availability — actual run time vs. planned production time
- Performance — actual output rate vs. ideal rate
- Quality — good units produced vs. total units produced
According to OEE.com, 85% is the widely cited world-class benchmark for discrete manufacturing, while most facilities operate closer to 60%. That 25-point gap represents significant recoverable production capacity.
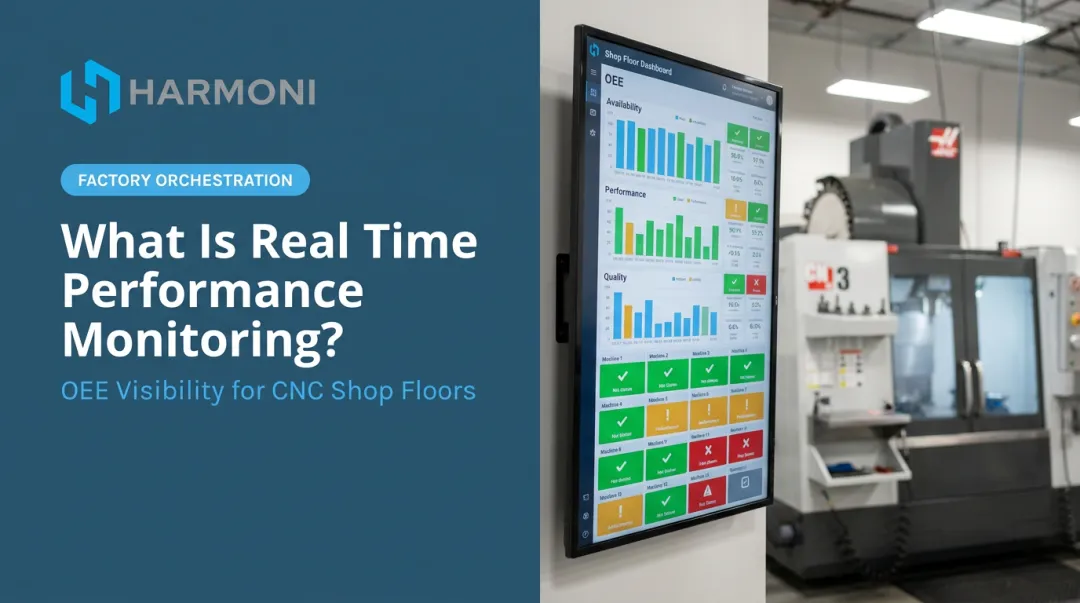
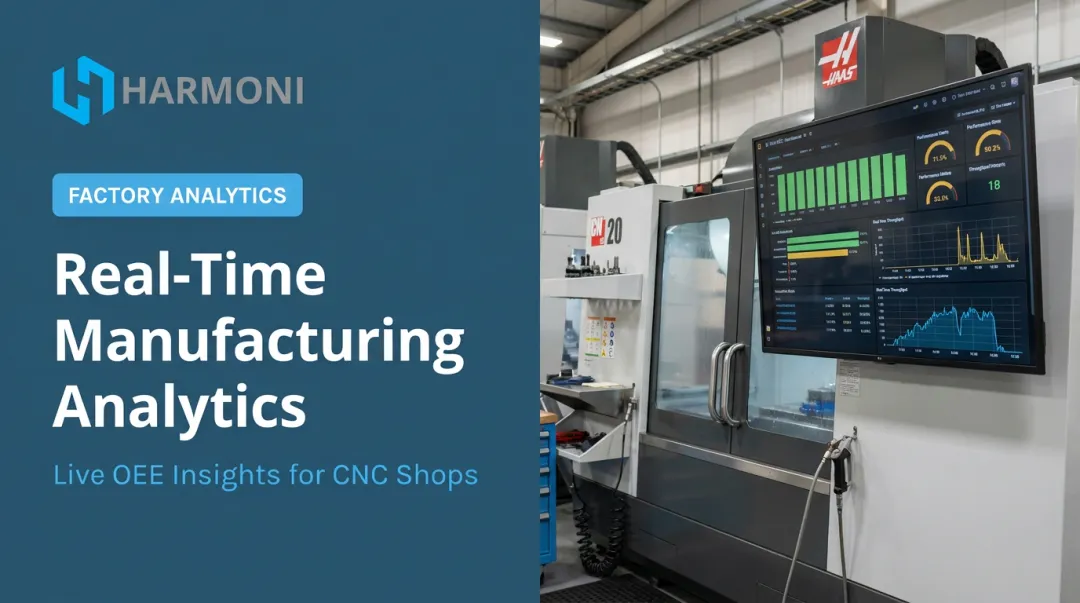
Tracking OEE in real time changes what's possible. When Availability drops because a machine goes down unexpectedly, or Performance slips because a worn tool is slowing cycle times, or Quality dips because a fixture is out of position — those signals appear immediately in live dashboards. Post-shift calculations confirm the loss. Real-time OEE enables the response before the shift ends.
Throughput and Capacity Utilization
Throughput measures the number of good units produced per unit of time. Capacity Utilization measures what percentage of total available production capacity is actively being used.
Together, these two metrics answer a question that surprises many operations managers: how much production potential is being left on the table right now?
Real-time throughput monitoring gives supervisors room to act. When live data surfaces a bottleneck workcenter mid-run, they can:
- Rebalance operator assignments across workcenters
- Prioritize downstream jobs to protect on-time delivery
- Flag the constraint for immediate process review
Without live visibility, that bottleneck surfaces only when someone asks why the job isn't done.
Cycle Time and Takt Time
| Metric | Definition |
|---|---|
| Cycle Time | Actual time to complete one unit or operation |
| Takt Time | Rate at which units must be produced to meet customer demand |
Comparing the two in real time answers a simple question: are we keeping pace with what the customer needs?
When cycle time exceeds takt time mid-run, operators and supervisors have options: adjust staffing, reassign work, flag a process issue. When that deviation surfaces at end-of-shift, the window to correct it has already closed.
Quality and Defect Control KPIs
First Pass Yield (FPY)
FPY = (Total Units Produced – Defective Units) ÷ Total Units Produced
First Pass Yield measures the percentage of units that meet quality standards on the first pass — no rework, no scrap. It's often the earliest signal that something is wrong with a process, machine, or incoming material.
A declining FPY calculated only at end-of-run tells you a problem existed. The same metric monitored continuously lets quality engineers correlate yield drops with specific machines, operators, or time windows while production is still active. Root cause analysis becomes targeted, not retrospective.
Scrap Rate, Rework Rate, and DPMO
These three metrics form the core of real-time defect control:
- Scrap Rate = Scrap Units ÷ Total Units Produced — parts that cannot be recovered; a sunk cost
- Rework Rate = Reworked Units ÷ Total Units Produced — fixable defects that add hidden labor hours and distort job costing
- DPMO = (Total Defects ÷ Total Units Produced) × 1,000,000 — a precision quality metric used in high-volume operations; Six Sigma targets a DPMO of 3.4 or fewer
The distinction between scrap and rework matters operationally. Scrap is visible and immediate. Rework is often invisible — it consumes labor hours that don't appear as a line item loss but steadily cut into job profitability.
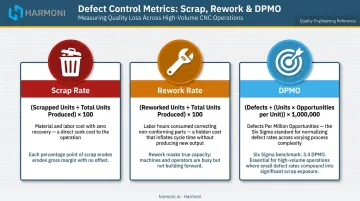
Real-time defect tracking prevents a defective process from running uncorrected for an entire shift. Batch-based inspection systems frequently miss this problem entirely: by the time a batch is reviewed, thousands of non-conforming parts may already exist.
Workforce, Maintenance, and Cost KPIs
Overall Labor Effectiveness (OLE) and Labor Visibility
OLE applies the same Availability × Performance × Quality framework to workforce rather than equipment — answering a different but equally important question: how effectively are operators being used during scheduled production time?
OLE = Availability × Performance × Quality (applied to workforce)
Labor visibility remains one of the biggest blind spots for manufacturers still relying on manual timekeeping or end-of-shift sign-offs. Without real-time operator data, it's impossible to reliably distinguish between a machine efficiency problem and a labor deployment problem — both reduce output, but each requires a different fix.
Machine Downtime Rate and MTBF
- Downtime Rate = Downtime Hours ÷ Total Available Hours
- MTBF = Operating Hours ÷ Number of Failures
Both are straightforward to calculate. Their real-time value comes from categorizing downtime as it occurs:
- Scheduled downtime — planned maintenance, changeovers
- Unscheduled downtime — mechanical failures, unexpected stops
- Operator-attributed downtime — waiting for materials, programs, or instructions
Each category points to a different corrective action. Aggregating them into a single downtime number obscures which intervention is actually needed.
Manufacturing Cost Per Unit and On-Time Delivery
Cost Per Unit = Total Manufacturing Cost ÷ Units Produced
Accurate job costing depends on capturing actual labor time, machine run time, and material consumption as they happen. When operators approximate inputs or log them hours later, the cost data becomes structurally unreliable — and pricing decisions downstream inherit that inaccuracy.
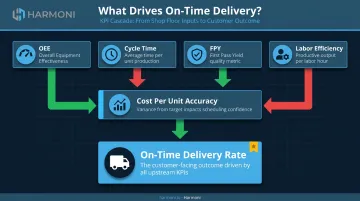
On-Time Delivery (OTD) is the downstream outcome metric that reflects how well all upstream KPIs are being managed. When OEE, cycle time, FPY, and labor efficiency are monitored and managed in real time, OTD improves as a natural result. Poor OTD is rarely its own problem. It's the compounded result of upstream metrics — cycle time drift, untracked downtime, labor gaps — that went unmonitored long enough to miss a delivery.
How to Monitor Manufacturing KPIs in Real Time
What Real-Time Monitoring Actually Requires
Genuine real-time KPI monitoring — not scheduled report refreshes, not end-of-shift summaries — requires three data streams feeding continuously into a unified view:
- Machine data — from CNC controls, PLCs, or direct machine integrations, capturing spindle status, cycle counts, and downtime events without manual logging
- Operator data — timestamped activity capture tied to specific jobs, machines, and time windows, ideally without requiring operators to manually enter data
- ERP data — job targets, planned production times, and material consumption from the system of record
All three must converge in one place. Separate dashboards for each data source create the same blind spots as having no dashboards at all.
How Harmoni Addresses This
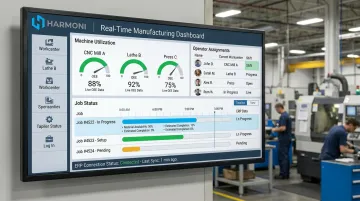
Harmoni's factory orchestration platform sits between ERP systems, machines, and operators — connecting all three data streams into unified real-time dashboards that plant leaders can access from any device as production runs. Each connection is purpose-built:
- Machine integrations cover major CNC controls: Mazak, Haas, Fanuc, Heidenhain, Siemens, DMG MORI, Makino, and Fadal
- Operator tracking uses long-range RFID to automatically capture who is running what job on which machine — no manual clock-ins required
- ERP connections pull job-level targets and planned production times from Epicor, Infor, JobBoss, ABAS, ODOO, and others directly into the same view
Enjet Aero, an Indiana aerospace machining facility, saw machine utilization rise from 378 to 519 hours per machine per month after replacing spreadsheet estimates with automated monitoring. Harmoni deploys in weeks with no machine replacement required — the platform retrofits to existing equipment regardless of age or manufacturer.
Making KPIs Actionable at the Machine Level
Real-time data on a manager's screen is useful. The same data at the workcenter level is what actually changes behavior.
Harmoni's shop floor displays give operators direct visibility into job status, work instructions, and quality checksheet requirements at their machine — alongside the andon-style Visual Factory indicator lights that communicate OEE conditions without requiring anyone to consult a dashboard. When an operator can see that production is falling behind pace or that a quality alert has triggered, they can self-correct. Visibility at the machine is what closes the loop between data collection and action on the floor.
Frequently Asked Questions
What are the key real-time manufacturing metrics?
The most critical categories are equipment efficiency (OEE, throughput, cycle time vs. takt time), quality (FPY, scrap rate, DPMO), workforce performance (OLE, labor utilization), and maintenance (downtime rate, MTBF). "Real-time" means these are monitored as production runs, not reviewed after the shift ends.
What is the difference between real-time KPIs and lagging indicators in manufacturing?
Lagging indicators are reviewed after production events have already occurred: end-of-shift OEE, weekly defect reports, monthly scrap summaries. Real-time KPIs stream live data so supervisors and operators can intervene while the production run is still active, before losses become permanent.
How is OEE calculated in real time?
OEE = Availability × Performance × Quality. Real-time OEE requires live data feeds from machines tracking run time, actual output rate, and defect counts. Automated systems handle this without manual input at shift end, delivering a live number operators can act on rather than a post-shift summary.
Which manufacturing KPIs should be visible on the shop floor?
Operators benefit most from seeing cycle time vs. takt time, current production count vs. target, active job status, and quality alerts. Supervisors additionally need OEE by workcenter, downtime cause categories, and FPY trends across the floor.
How do manufacturers collect real-time production data?
Real-time data flows from direct machine integrations (CNC controls, PLCs), operator activity capture (RFID, touchscreen terminals), and ERP/MES connections. A central platform aggregates all three streams and surfaces them without manual entry.
What is a good OEE score for a manufacturing facility?
World-class OEE is benchmarked at 85% for discrete manufacturing, while many facilities operate between 40–60%. Improving OEE requires identifying which of the three components — Availability, Performance, or Quality — is the primary source of loss, then addressing that root cause specifically.