Introduction
It's 2:47 a.m. and a database server just went dark. By the time the on-call engineer acknowledges the alert, orders have stopped processing and customers are staring at error pages. The same pattern holds on a shop floor: an alert reports that something changed, but acting on it while production is still running depends on knowing which job, which operator and which machine it touches.
That kind of outage isn't cheap. According to ITIC's 2024 downtime cost survey, more than 90% of midsize and large enterprises report that a single hour of downtime costs over $300,000. Another 41% say it runs between $1 million and $5 million or more.
System monitoring software exists to keep that call from ever happening. It gives IT and operations teams real-time visibility into servers, networks, applications, and infrastructure health, catching small issues before they snowball into outages.
This guide ranks the top system monitoring tools for 2026 across IT infrastructure, networks, and hybrid/cloud environments. We'll also cover why manufacturing shop floors need a different kind of monitoring altogether.
Key Takeaways
- System monitoring software tracks uptime, performance, and resource usage across servers and apps.
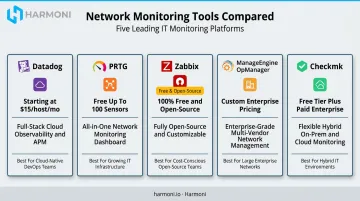
- Top picks by category: Datadog (cloud-native), PRTG (network-focused), Zabbix (free/open-source).
- Prioritize scalability and integrations, plus alerting depth and pricing, over brand name.
- IT monitoring tools stop at the server room — shop floor equipment needs its own category of software.
Overview of System Monitoring Software in the IT Industry
System monitoring software continuously tracks CPU usage, memory, disk space, network traffic, and uptime across an IT environment. It flags anomalies before they become failures, giving teams one source of truth for infrastructure health.
Grand View Research valued the global observability tools and platforms market at $2.7 billion in 2023, projecting it to reach $3.5 billion by 2026 and $5.4 billion by 2030, a 10.7% compound annual growth rate.
That growth lines up neatly with the downtime numbers above. When an hour offline can cost six figures, monitoring tools pay for themselves the first time they catch a problem early.
Types of Monitoring Worth Knowing
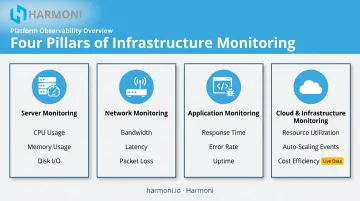
Not every tool solves the same problem. Before you shop, know the categories:
- Server monitoring: tracks CPU, memory, and disk usage on physical or virtual machines
- Network monitoring: watches devices, links, bandwidth, and traffic
- Application monitoring: measures performance and errors within specific software
- Cloud/infrastructure monitoring: unifies visibility across hybrid and multi-cloud environments
The list below ranks the top tools available in each category for 2026.
Top System Monitoring Software & Tools in 2026
We evaluated each platform on reliability, feature depth, scalability, ease of setup, and pricing transparency.
Datadog
Datadog is a full-stack, cloud-native monitoring platform built for scale, and it's become the default choice for teams that need infrastructure, application, and log data in one place.
What sets it apart:
- Real-time infrastructure, application, and log monitoring in one dashboard
- 1,000+ out-of-the-box integrations with strong visualization
- Distributed tracing and synthetic monitoring for deeper application performance insight
- Premium pricing that climbs quickly as host and container counts grow
| Category | Details |
|---|---|
| Pricing | Free tier for up to 5 hosts; Pro starts at $15/host/month annually; Enterprise starts at $23/host/month annually |
| Key Features | Infrastructure monitoring, APM, log management, cloud/container monitoring |
| Best For | Enterprises with significant cloud infrastructure needing unified observability |
PRTG Network Monitor
Paessler built PRTG as a sensor-based tool for combined network and server monitoring in one dashboard, popular with teams that want broad coverage without a steep learning curve.
Standout capabilities:
- Automatic network discovery that speeds up initial setup
- 250+ pre-configured sensor types covering nearly any device or metric
- Flexible hosting (on-prem or cloud) with distributed remote probes for multi-site networks
| Category | Details |
|---|---|
| Pricing | On-prem starts at $200/month for PRTG 500 (annual); hosted plans start at $2,399/year; free tier covers 100 sensors permanently |
| Key Features | Auto-discovery, customizable dashboards, multi-channel alerting, distributed remote probes |
| Best For | SMBs and IT teams wanting centralized, low-complexity monitoring |
Zabbix
Zabbix is free, open-source, and backed by an active global community. There's no license fee and no cap on hosts, metrics, or alerts.
Why teams choose it, and where it bites back:
- Deep agent-based insights with highly customizable templates
- Native WMI integration for Windows environments
- A steeper setup curve. Someone on your team has to manage the OS, database, and data retention
Zabbix's documentation puts real numbers on that overhead: monitoring 1,000 metrics needs 2 CPU cores and 8 GiB of RAM, scaling to 32 cores and 96 GiB for a million metrics. Optional commercial support starts at $325/month if you want a safety net.
| Category | Details |
|---|---|
| Pricing | Free/open-source; factor in hosting, maintenance, and in-house expertise as real costs |
| Key Features | Metrics collection, threshold-based alerting, customizable dashboards and templates |
| Best For | Technically skilled teams wanting a free, fully customizable solution |
ManageEngine OpManager
OpManager offers agent and agentless flexibility for network and server management, with a probe-central architecture that suits organizations running multiple sites.
Notable differentiators:
- ML-based adaptive thresholds that train on network data for 14 days, then recalculate hourly
- Code-free, drag-and-drop workflow automation for routine checks and fault response
| Category | Details |
|---|---|
| Pricing | Standard starts at $95 for 10 devices; Enterprise starts at $4,595 for 250 devices (annual); free edition covers 3 devices |
| Key Features | Network topology mapping, adaptive alert thresholds, workflow automation, capacity forecasting |
| Best For | Mid-to-large enterprises managing multi-site or distributed network infrastructure |
Checkmk
Checkmk is built for hybrid and multi-cloud environments, and it's a common pick among managed service providers running monitoring across multiple clients.
Where it earns its spot on this list:
- End-to-end stack coverage with automatic host and service discovery
- Business Intelligence tooling that maps dependencies and runs "what if" impact analysis
- Predictive monitoring that forecasts utilization and sets adaptive thresholds
- Native Kubernetes and container monitoring built for modern cloud-native stacks
| Category | Details |
|---|---|
| Pricing | Community edition free for |
| Key Features | Log monitoring, predictive analytics, hardware/software inventory, customizable dashboards |
| Best For | Mid-to-large IT teams and MSPs managing hybrid or multi-cloud environments |
Beyond IT: Monitoring Systems on the Manufacturing Shop Floor
Every tool above answers the same question: is our IT infrastructure healthy? They watch servers, networks, and applications. None of them know what's happening on a CNC machine, whether an operator is running the right job, or if a part just slipped out of tolerance.
That's a different problem, and it needs a different kind of monitoring.
Why IT Tools Stop at the Shop Floor Door
A traditional monitoring tool can confirm a machine's computer is powered on and connected to the network. Beyond that basic check, it has zero visibility into what's actually happening at the machine:
- Which job, part, and revision are actually running
- Whether the correct CNC program was loaded for that job
- How long an operator has been active at a given work cell
- Whether quality checkpoints are passing or a part is drifting toward scrap
That's exactly the gap Harmoni, a factory orchestration platform, was built to close. Rather than replacing existing ERP or MES systems, it operates alongside them as the missing coordination layer.
How Harmoni Fills the Gap
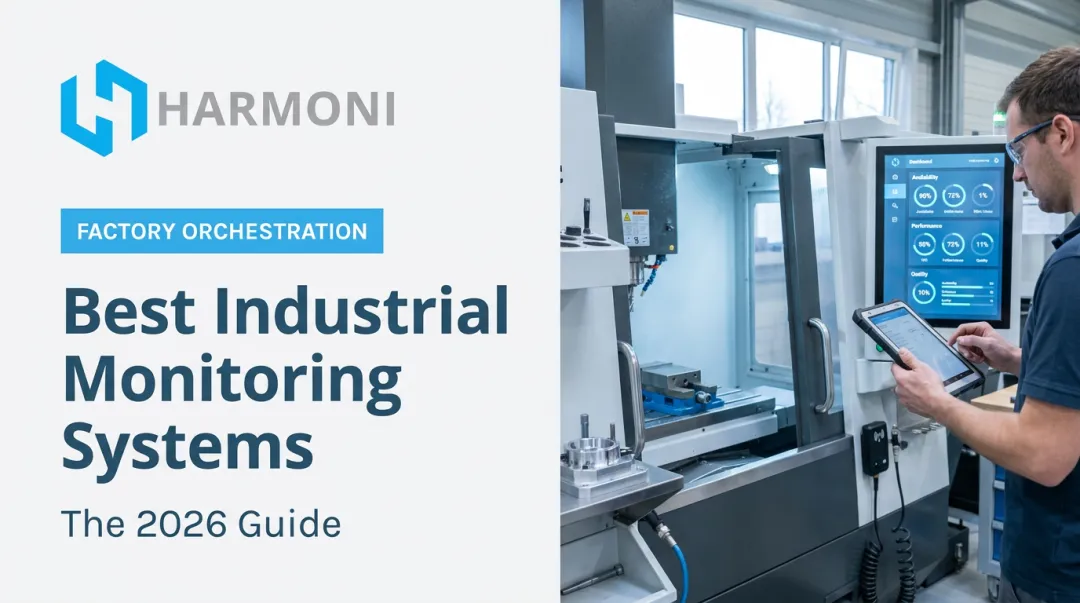
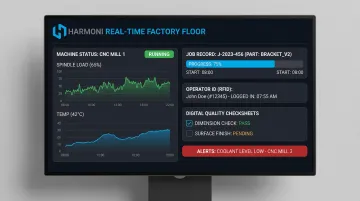
Harmoni sits between ERP, MES, machines, and operators, using long-range RFID detection and real-time dashboards to unify machine data, operator activity, and ERP workflows in one view.
In practice, that means:
- CNC spindle data ties directly to ERP records, so managers see actual job costs and margins, not just planned ones
- RFID badges identify operators and jobs automatically, feeding labor and accountability data into the system without manual entry
- Digital checksheets capture quality data in real time, flagging out-of-tolerance conditions before scrap happens
Mid-to-large manufacturers in CNC machining, aerospace, defense, and automotive use this visibility to catch production errors as they happen, not after the job has already shipped. One published case study on a beryllium parts shop using Harmoni documented 17 productive hours gained per employee per month and a 10% reduction in delinquent jobs after adoption.
How We Chose the Best System Monitoring Tools
The most common mistake buyers make is picking a tool based on brand recognition or a long feature list, then discovering it doesn't fit their actual infrastructure or their team's technical bandwidth.
To avoid that outcome, we weighed each platform against factors that translate directly into results like reduced mean time to resolution and lower total cost of ownership:
- Real-time metric granularity: how detailed and current the data actually is
- Alerting flexibility: whether thresholds adapt automatically or need constant manual tuning
- Integration ecosystem: how easily the tool connects to what you already run
- Deployment options: agent versus agentless, cloud versus on-prem
- Pricing transparency: whether the published price reflects what you'll pay at scale
A tool that scores well on paper but takes six months of in-house tuning isn't actually cheaper than a pricier platform that deploys in a week. Total cost of ownership includes setup time and maintenance, not just the license fee.
Conclusion
There's no universal "best" system monitoring tool. The right pick depends on aligning capabilities with your actual infrastructure, whether that's cloud-native workloads, a sprawling multi-site network, or a tight budget with technical skill in-house. IT-focused tools also solve a different problem than production-floor visibility.
Before committing, pilot a shortlist of tools, stress-test their scalability and support quality, and account for hidden costs like setup time and ongoing maintenance.
If you're a mid-to-large manufacturer, you need real-time visibility into machines, operators, and job execution beyond what traditional IT monitoring offers. Harmoni's factory orchestration platform was built for that exact gap. Request a demo or reach out at (888) 341-4097 or sales@harmoni.io.
Frequently Asked Questions
Which monitoring tool is best?
There's no single best tool. It depends on your use case: Datadog for cloud-native stacks, PRTG for network-heavy environments, and Zabbix for teams with technical skill and a tight budget.
What is the best network monitoring software?
PRTG and ManageEngine OpManager are both strong network-focused picks. Network monitoring watches devices, links, and traffic specifically, while general system monitoring covers the broader IT environment, including servers and applications.
What are common types of monitoring software?
Common categories include infrastructure/server monitoring (Zabbix, Checkmk), network monitoring (PRTG, OpManager), application performance monitoring (Datadog), and log monitoring (Datadog, Checkmk).
What is system monitoring software?
System monitoring software tracks uptime, performance, and resource usage, including CPU, memory, disk, and network activity, across servers, networks, and applications. It helps teams catch issues before they cause outages.
What's the difference between IT system monitoring and shop-floor production monitoring?
IT monitoring tracks servers, networks, and applications. Factory orchestration platforms like Harmoni instead track machines, operators, and job execution against ERP and MES data.
Is free or open-source monitoring software good enough for enterprise use?
It can be, but it's a tradeoff. Open-source tools like Zabbix cut license costs but require in-house setup and maintenance expertise, while paid platforms deploy faster with dedicated support built in.