Introduction
Most manufacturers aren't short on data. They're short on data they can act on.
According to the Manufacturing Leadership Council, 70% of manufacturers still collect production data manually — and 44% reported that their data volume doubled in just two years. Yet in most shops, that data sits in shift logs, spreadsheets, and paper travelers until someone compiles it into a report that's already 48 hours old.
The result is familiar: missed delivery dates no one saw coming, scrap that accumulated through three shifts, and job costs that don't match actuals until the invoice is already out.
This guide covers the full picture — from what a production report must include and which KPIs actually matter, to how to build a reporting process that gets used and how to move from backward-looking documents to real-time shop floor visibility.
Key Takeaways
- Useful production reports cover output, labor, machine performance, materials, and quality together — not in isolation
- KPIs without a baseline are just numbers — define what "good" looks like before you start tracking
- Weekly reporting often beats daily for mid-size shops by reducing noise and surfacing clearer trends
- Automated data collection turns reporting from a periodic task into a continuous operational feedback loop
- Real-time visibility closes the gap between when problems occur and when managers find out
What Is a Manufacturing Production Report?
A manufacturing production report is a structured document that records and summarizes production activity — output quantities, labor time, machine performance, and quality results — against planned targets. Its purpose is to support data-based decisions rather than gut-feel guesswork.
Two terms are worth keeping separate:
- Production reporting — the ongoing process of capturing data at the point of production
- A production report — the compiled output summarizing a shift, day, or week
Reports can cover different time horizons depending on operational complexity. A high-volume automated line might generate shift-level reports continuously. A high-mix, low-volume job shop might compile weekly summaries.
Who Uses Production Reports?
Each level of the organization extracts something different from the same data:
- Shop floor supervisors use reports to identify what went wrong and why, so they can correct it before it repeats
- Plant managers track departmental trends over time and allocate resources accordingly
- Executives use rolled-up summaries to assess overall operational health, profitability, and capacity
A report that tries to serve all three audiences equally usually serves none of them well — design for a specific reader and a specific decision.
What Should a Manufacturing Production Report Include?
Output and Order Status
This is the baseline — the data that tells you whether the floor is performing or falling behind.
- Finished goods count per shift or day
- Production rate versus planned rate
- Work-in-process (WIP) levels
- On-time versus delayed status of active customer orders
Output tracking answers the most fundamental question on the floor: Are we making what we planned to make?
Labor Time
Separating direct and indirect labor reveals whether an efficiency problem is a process problem or a time management problem.
- Direct labor: Time spent on value-adding tasks, compared to estimated (standard) time
- Indirect labor: Setup, cleanup, waiting, meetings — tracked against a budgeted allowance
When actual time exceeds estimated time, efficiency falls below 100%. That gap is where improvement lives.
Machine and Equipment Data
Machine data provides essential context for capacity decisions, but it requires pairing with operator and job data to mean anything useful.
- Machine uptime and downtime, categorized by reason (maintenance, breakdown, material shortage)
- Utilization rates across each workcenter
A machine showing 60% uptime is a problem or an acceptable outcome depending on whether that downtime was planned preventive maintenance or a surprise breakdown. The reason code is what tells you which one you're dealing with.
Material Consumption
This data is the foundation for accurate job costing and waste reduction.
- Raw materials used versus expected per production order
- Scrap generated (by job, by operator, by machine)
- Write-offs and material variances
Shops that track material consumption can pinpoint exactly where costs are running over — and correct it before the next job runs.
Quality Control Results
Quality data captured in reports lets patterns surface before they become systemic failures.
- Defect counts by type and location in the process
- First pass yield (FPY) — percentage of units completed without rework
- Inspection checkpoints passed or failed
- Rework hours logged
The earlier in the production sequence a quality deviation appears in a report, the cheaper it is to fix.
Key KPIs to Track in Manufacturing Production Reports
Overall Equipment Effectiveness (OEE)
OEE is the most widely used single metric for equipment performance. It combines three factors:
| Factor | Formula | What It Measures |
|---|---|---|
| Availability | Run Time ÷ Planned Production Time | Uptime vs. scheduled time |
| Performance | Net Run Time ÷ Run Time | Speed vs. rated capacity |
| Quality | Fully Productive Time ÷ Net Run Time | Good units vs. total produced |
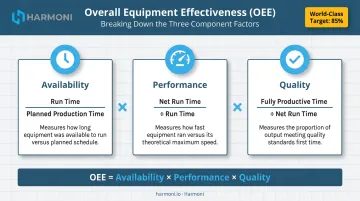
The world-class OEE target — derived from TPM methodology — is 85% (90% availability × 95% performance × 99% quality). OEE.com notes that many manufacturers operate closer to 60%, with a significant number below 45%. The gap between 60% actual and 85% world-class is where most production improvement programs earn their ROI.
Labor Efficiency
Labor efficiency is the ratio of estimated time to actual time for direct labor tasks. When actual time exceeds estimated time, efficiency drops below 100%.
Tracked at the employee and department level, then rolled up to the supervisor, this metric creates a scoreboard that:
- Motivates improvement through visibility
- Surfaces employees who need additional training
- Identifies processes where time estimates are no longer accurate
First Pass Yield and Scrap Rate
These two quality metrics work together — neither tells the full story alone.
- First Pass Yield (FPY): The percentage of units completed correctly without scrap, rerun, retest, or offline repair, as defined by ASQ
- Scrap rate: Material wasted as a percentage of total material used
APQC's 2024 benchmark of 1,008 organizations reports median scrap-and-rework cost at 1.0% of sales across industries. In high-mix, low-volume environments with complex parts, the exposure is typically 2–3× that figure.
Cycle Time and Throughput Time
Two distinct but related speed metrics:
- Cycle time: How long each process step actually takes versus the standard rate
- Throughput time: Total elapsed time from job start to completion
Deviations from standard cycle times are an early warning system for bottlenecks. A workcenter running 20% over standard cycle time will back up everything upstream — often before the ERP shows any signal.
Capacity Utilization
The Federal Reserve's June 2026 G.17 data puts durable manufacturing capacity utilization at 75.9% — a sector-level figure that provides useful context, not a plant-level target to hit.
At the plant level, capacity utilization helps production managers make informed decisions about scheduling, overtime, and equipment investment — before constraints become crises, not after.
How to Create and Implement Production Reporting That Gets Used
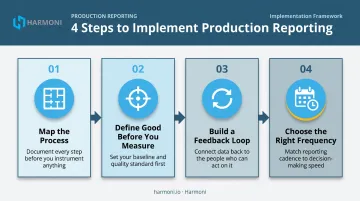
Step 1: Map the Process First
Before designing any report, walk the production floor and document every stage, task, and handoff where data needs to be captured. Skipping this creates reports that either miss critical data points or collect information no one acts on.
Step 2: Define "Good" Before You Measure
Standards and estimates must exist before the first report is generated. Without them, you're counting output, not calculating efficiency.
Define, in advance:
- Standard times for each direct labor task
- Budgeted indirect time per shift
- Target thresholds for each KPI
These become the denominator in every efficiency calculation. Without them, you can only report what happened — not how well you performed against plan.
Step 3: Build a Feedback Loop, Not a Distribution List
The most common way production reports fail is when they get distributed but never discussed.
A structured feedback loop looks like this: supervisors identify the top three reasons their department fell below 100% efficiency each week and document those reasons before the next review. That requirement forces the report from a passive document into an active management tool.
Production reports used as a punitive instrument destroy their own effectiveness. When operators and supervisors learn that data is used to assign blame, they learn to manage the data instead of the process. The goal is identification and correction — not scorekeeping for discipline.
Step 4: Choose the Right Reporting Frequency
Frequency should match operational complexity:
- Weekly reporting works well for most mid-size job shops — daily noise gets filtered out, and meaningful trends have time to surface
- Daily reporting often generates too many items to address, producing paralysis instead of action
- Shift-level or real-time reporting makes sense for high-volume or highly automated environments where a single shift can produce significant volume or scrap
More frequent isn't always better. Aim for the cadence that produces a short, workable list of issues — one your team can actually close out before the next reporting cycle begins.
Production Reporting Best Practices
Standardize Data Collection Before Analyzing Data
Consistency in format and collection procedures — documented as SOPs — is the foundation of reliable reporting. Without it, data from different shifts, departments, or operators becomes incomparable.
Harmoni's platform addresses this through automation: by removing manual data entry at clock-in, job selection, and program loading, the system enforces consistency by design rather than relying on procedural compliance. In shops running two or three shifts with mixed operator experience, procedural compliance alone rarely holds — built-in enforcement does.
Once your collection process is consistent, the next challenge is deciding what to measure.
Track Fewer KPIs, Not More
Reporting every available data point creates information overload. Decision-makers tune out reports that require them to scan 30 metrics to find the two that matter.
The test for any KPI: Can someone take a specific action based on this metric? If the answer is unclear, cut it.
A useful production report surfaces three to five KPIs that are:
- Tied to a specific business objective (delivery, cost, quality)
- Actionable by the person reading them
- Consistently measured using the same methodology
Narrowing what you track is only half the equation. The other half is making sure your reporting process itself stays current.
Review the Reporting Process, Not Just the Data
Schedule a quarterly review of the reporting process itself. KPIs that were meaningful six months ago may have become irrelevant as the business has changed. New blind spots may have emerged that existing reports don't capture.
During each review, ask:
- Which metrics drove decisions last quarter?
- Which reports went unread or were skimmed?
- What operational changes created gaps in current coverage?
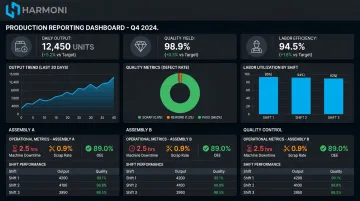
From Static Reports to Real-Time Shop Floor Visibility
Traditional production reports are backward-looking by design. A report compiled at the end of a shift documents problems that occurred hours earlier. The scrap is already in the bin. The deadline is already at risk.
The real upgrade isn't faster reports. It's continuous visibility.
How Automated Data Collection Changes the Equation
Manual data entry introduces two problems simultaneously: errors and delays. An operator filling out a paper traveler at the end of a shift is working from memory, under time pressure, with no validation layer catching mistakes.
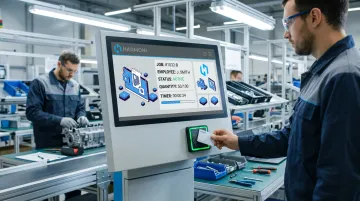
Automated data collection through shop floor terminals, RFID technology, and direct CNC machine connections removes that dependency entirely. Data is captured at the point of production, in real time, without requiring operators to stop and record it separately.
Harmoni's factory orchestration platform uses long-range RFID to automatically detect which employee is at which workcenter and which job they're working on — no manual clock-in required. That data feeds directly into production dashboards, creating a continuous stream of labor, machine, and job information that managers can access from any device.
The Problem With Siloed Data Streams
Most manufacturers have data — they just have it in three different places:
- Machine data in a monitoring system
- Labor time in the ERP
- Job status somewhere in between
Reconciling those three streams manually is slow and error-prone. By the time a manager pieces together a complete picture, managers have usually missed the window to act.
A unified view that combines machine data, operator activity, and ERP workflow data changes when problems can be addressed. Harmoni's platform pulls CNC spindle data, employee time data, and ERP job data into a single operational view, with exception alerts sent automatically when anomalies occur — so managers don't have to be watching the dashboard to catch a problem in progress.
That means instead of discovering at the weekly review that a workcenter ran at 55% efficiency, a manager sees the deviation as it develops and can intervene before it compounds across the shift.
Frequently Asked Questions
What is a production report in manufacturing?
A production report is a structured document summarizing key manufacturing data — output quantities, labor time, machine performance, material usage, and quality results — compared against planned targets. It converts raw shop floor activity into information that supports operational decisions.
Who fills out the production report?
Responsibility typically falls on shop floor operators and supervisors, who log labor time, output, and quality data at the point of production. Supervisors compile and review shift or daily data before escalating summaries up the management chain.
What should a manufacturing production report include?
A complete report covers five core categories: finished goods output and order status, direct and indirect labor time, machine uptime and utilization, material consumption and scrap, and quality results including defect counts and first pass yield.
How often should production reports be generated?
Frequency depends on operational complexity. Weekly reporting works well for many job shop environments — it filters daily noise and surfaces meaningful trends. High-volume or highly automated operations benefit from shift-level or real-time reporting.
What is the difference between manual and automated production reporting?
Manual reporting requires operators to enter data by hand, introducing delays and error risk. Automated reporting uses digital tools, direct machine connections, and RFID to capture data in real time — improving accuracy, cutting operator burden, and enabling faster response when problems arise.