Introduction
Most manufacturers aren't short on data. They're short on the right data at the right moment. Production reports land in inboxes hours after a shift closes, long after a quality issue has generated scrap, a machine failure has cascaded into missed deliveries, or a bottleneck has choked throughput for an entire run. A dashboard shortens that lag, but reporting status is still not the same as coordinating the response — that needs the machine, the operator and the ERP job connected so the next action is obvious while the shift is still running.
The gap between high-performing and struggling operations often isn't process design or workforce skill. It's whether the metrics that matter are visible while something can still be done about them.
NIST estimates $119.1 billion in preventable annual maintenance losses across U.S. discrete manufacturing — losses tied directly to delayed detection and reactive responses. That's a solvable problem, and it starts with knowing which KPIs to track and how to surface them in real time.
This guide covers the essential manufacturing KPIs, how to organize them into meaningful dashboards by role and category, and what separates a genuinely useful dashboard from a glorified spreadsheet on a monitor.
Key Takeaways
- Real-time KPI visibility is what makes intervention possible — after-the-fact reporting means the window to act has already closed
- Focus KPI tracking on four categories: efficiency, quality, equipment performance, and cost
- Build dashboards for multiple audiences — operators, supervisors, and executives need different data at different cadences
- Tracking too many KPIs dilutes focus just as much as tracking too few — tie every metric to a specific operational goal
What Are Manufacturing KPIs and Metrics?
A metric is any measurable data point about a production process — units produced per hour, machine cycle time, number of defects logged. A KPI (Key Performance Indicator) is a metric attached to a specific target and business objective.
Here's the practical difference: units per hour is a metric. It becomes a KPI when the goal is maintain 95% production attainment against the daily schedule. Without a target, a data source, and a defined reporting frequency, you're tracking noise, not performance.
Why Manufacturing-Specific KPIs Matter
Generic business metrics — revenue per employee, gross margin, customer satisfaction — miss what actually drives manufacturing performance. Equipment effectiveness, defect rates, and labor utilization require their own measurement frameworks because the variables are structurally different from service or distribution operations.
At the scale of a mid-to-large machining or precision manufacturing facility, small efficiency improvements compound quickly. Reactive maintenance practices alone — those that respond to failure rather than preventing it — are associated with 3.3 times more downtime and 16 times more defects compared to facilities that use preventive and predictive approaches, according to NIST research on manufacturing maintenance effectiveness.
The SMART Criteria for Manufacturing KPIs
A well-constructed manufacturing KPI is:
- Specific — tied to a particular machine, process, or product line
- Measurable — has a defined formula and data source
- Actionable — when it goes red, someone knows what to do
- Realistic — benchmarked against achievable targets, not theoretical maximums
- Time-based — reviewed at a defined cadence matched to its operational relevance
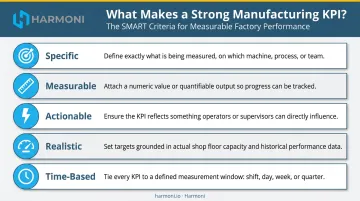
A KPI that fails any of these criteria gets tracked but never acted on — adding reporting overhead without changing what happens on the floor.
The Essential Manufacturing KPIs Every Dashboard Should Track
Efficiency KPIs
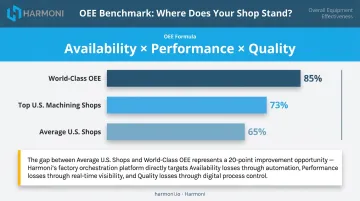
OEE (Overall Equipment Effectiveness) is the standard bearer for measuring productive manufacturing time. The formula:
OEE = Availability × Performance × Quality
- Availability — actual run time vs. planned production time
- Performance — actual output rate vs. ideal output rate
- Quality — good units vs. total units produced
The commonly cited world-class OEE benchmark is 85%, a threshold traced to Seiichi Nakajima's TPM work at the Japanese Institute of Plant Maintenance, documented in Introduction to TPM (1984). To put that in context, Modern Machine Shop's Top Shops survey found median OEE of 73% for leading U.S. machining shops and 65% for others — meaning most facilities have meaningful room to improve.
Throughput (units produced per time period) measures raw output capacity — how much the floor is actually producing against available time.
Cycle Time (process end time minus process start time) completes the efficiency picture. Cycle time deviation — when actual cycle time drifts from the expected value — is one of the most reliable early signals of an emerging quality or downtime problem.
Quality KPIs
First Pass Yield (FPY) measures what percentage of units complete production correctly without rework:
FPY = Good units / Total units produced
A low FPY doesn't just indicate waste — it signals upstream process failures. In one NIST precision manufacturing case, FPY improvements from 10% to 90% cut lead time from 43 days to 5 days, with $2 million in increased or retained sales.
Scrap Rate (scrap units / total units produced) hits profitability directly through material cost, capacity loss, and potential delivery delays.
Equipment and Maintenance KPIs
Quality metrics tell you what came off the line. Equipment KPIs tell you why production stalled in the first place.
Machine Downtime Rate (downtime hours / total scheduled hours) should always distinguish between planned and unplanned events. Planned downtime — scheduled maintenance, changeovers, calibration — is controllable. Unplanned downtime is not, and the cost difference is stark: Siemens' 2024 report puts unplanned downtime at $2.3 million per hour for a large automotive plant.
MTBF (Mean Time Between Failures) and MTTR (Mean Time to Repair) are the core predictive maintenance pair. A rising MTBF signals improving equipment reliability; a falling MTTR means faster response when failures do occur.
Cost and Labor KPIs
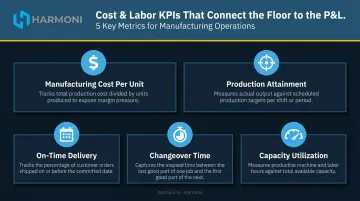
Cost and labor metrics connect shop floor activity to financial outcomes — often revealing problems before they appear on a P&L. Five to track:
- Manufacturing Cost Per Unit (total manufacturing cost / units produced) — the foundational metric tying production efficiency to margins
- Production Attainment — percentage of periods where targets were met; drops here are an early warning of downstream cost overruns
- On-Time Delivery — the customer-facing consequence of poor production planning and the metric that affects repeat business most directly
- Capacity Utilization (actual output / maximum possible output × 100) — signals whether a facility is underloaded, optimized, or approaching a constraint
- Changeover Time — a critical lever in lean operations; every minute saved here is productive time recovered
How to Organize Your Manufacturing KPI Dashboard by Category
A single dashboard that tries to show everything fails everyone. The more effective structure is layered views: different KPIs presented to different roles at different cadences.
Production Performance Dashboard (Operator-Facing)
This is the view that must update continuously. Operators and line supervisors need to see:
- Real-time throughput vs. schedule
- Actual cycle time vs. takt time
- Production attainment vs. daily target
- Machine utilization by workstation
If this view is delayed by even an hour, the opportunity to intervene has passed. Problems caught mid-shift can be corrected. Problems found in the morning meeting cannot.
Equipment Health Dashboard (Maintenance and Supervisory)
This view supports proactive scheduling, not reactive firefighting:
- OEE by machine, updated per shift
- Downtime events categorized as planned vs. unplanned
- MTBF and MTTR trends over time
- Percentage of maintenance that is planned vs. reactive
Quality Dashboard (Quality Engineers and Supervisors)
Quality dashboards need historical trend visibility, not just current-shift snapshots. Track:
- First Pass Yield by part number and machine
- Scrap Rate by job and operator
- Defect trends over time, tracked by recurrence to surface systemic issues before they compound
Cost and Financial Dashboard (Management)
Unlike operator-facing views, this dashboard doesn't need real-time refresh — but it's critical for connecting shop floor decisions to financial outcomes:
- Manufacturing Cost Per Unit
- Cost as a percentage of revenue
- Inventory turns
- Earned hours vs. estimated hours by job
Each of these four views draws from the same underlying data — what changes is the time horizon, the audience, and the decision each view is designed to support. Getting the structure right is what turns a dashboard from a reporting tool into an operational one.
What Makes an Effective Manufacturing KPI Dashboard?
Real-Time Data, Not Lagging Reports
The most common dashboard failure is displaying data that's hours or days old. By the time a shift supervisor opens a report showing last night's scrap rate, the material is already scrapped and the machine is still producing out-of-spec parts — with the job falling further behind.
An effective dashboard pulls live data from machines, ERP systems, and operators simultaneously. The value isn't the visualization — it's the timeliness of what's being visualized.
Unified Data Sources
Dashboards built from siloed sources produce contradictory numbers. The machine says it ran 400 cycles. The ERP says 380 units were completed. The operator's paper log says something different. None of these numbers are trusted, and none drive decisions.
An effective dashboard integrates:
- Machine data — cycle counts, alarms, program status from CNC controllers
- ERP data — job schedules, work orders, material costs, estimated cycle times
- Operator inputs — quality entries, scrap reporting, job assignments
This is where Harmoni's factory orchestration platform provides a distinct capability. Rather than functioning as a standalone monitoring tool, Harmoni sits between ERP systems, machines, and operators — using RFID to detect active employees and jobs at each workcenter while centralizing machine and ERP data into one unified view. The result is complete operational context, not just machine uptime signals.
Alert-Driven, Not Report-Driven
A dashboard that waits to be opened is a passive tool. An effective manufacturing dashboard proactively surfaces exceptions — when cycle time deviates from target, when a machine crosses a downtime threshold, when a job is trending late against schedule.
Good alert logic is specific: scoped to a machine, a job number, or a part family — not a facility-wide average that masks where the problem actually lives. Harmoni's exception alert system, for example, notifies managers at the work cell level and enables them to contact the specific operator directly from their desk.
Fewer, Better Metrics
That same discipline applies to what you display. 5–7 well-chosen KPIs visible at all times outperform 30 KPIs that require scrolling to find. Dashboard clutter doesn't reflect operational sophistication. It creates confusion about what actually matters.
Start with a "Critical Number" — identify the one or two KPIs that, if improved this quarter, would have the greatest operational impact. Build the dashboard around those first. Add metrics selectively as they prove necessary.
Common Mistakes to Avoid When Building a Manufacturing KPI Dashboard
Tracking Too Many KPIs
When every metric is flagged as important, none of them are. Start with 5–7 KPIs tied to the current quarter's most pressing operational goals. Expand only when a new metric addresses a gap the existing set cannot.
Ignoring Leading Indicators
| Indicator Type | Examples | What They Tell You |
|---|---|---|
| Lagging | Monthly scrap rate, customer reject rate | What already went wrong |
| Leading | Cycle time deviation, changeover creep, micro-stoppages | What is going wrong now |
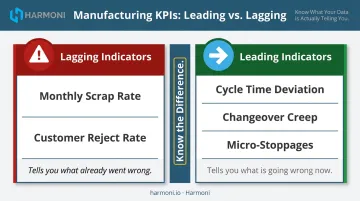
A dashboard built primarily on lagging indicators tells you what went wrong after the fact. Tracking real-time cycle time deviation, for instance, can surface a quality or downtime event before it shows up in the scrap rate — giving operators and supervisors a window to intervene.
Failing to Assign KPI Ownership
A KPI without an owner is a number, not a performance indicator. Every metric on the dashboard should have:
- A named responsible party — not a department, a person
- A defined response protocol when the metric goes red
- A review cadence matched to the metric's operational relevance
Ownership is what converts a dashboard from a display screen into an actual management tool — one that drives decisions, not just reports numbers.
Frequently Asked Questions
What are the 5 KPIs for manufacturing?
The five most commonly cited manufacturing KPIs are:
- OEE — percentage of planned production time that is genuinely productive
- On-Time Delivery — schedule adherence and its direct customer impact
- First Pass Yield — process quality measured without rework
- Production Attainment — schedule hit rate and a leading indicator of cost
- Manufacturing Cost Per Unit — total production cost divided by output units
What is a manufacturing dashboard?
A manufacturing dashboard is a centralized visual display that consolidates critical production KPIs — throughput, downtime, quality metrics, and more — into a single interface. It enables plant managers and operators to monitor performance and respond to issues in real time rather than after the shift ends.
What is the best KPI dashboard?
The best manufacturing KPI dashboard integrates live data from machines, ERP systems, and operators; presents different views to different roles (operator, supervisor, executive); and triggers proactive alerts when a metric crosses a threshold — rather than waiting for someone to open a report.
What is OEE in manufacturing?
OEE (Overall Equipment Effectiveness) equals Availability × Performance × Quality. It measures the percentage of planned production time that is genuinely productive. The widely referenced world-class benchmark is 85%, though most machining operations track closer to 65–73%.
What is the difference between a KPI and a metric in manufacturing?
A metric is any measurable data point — units produced, cycle time, scrap count. A KPI is a metric tied to a specific target or strategic objective. All KPIs are metrics, but not all metrics are KPIs. In practice, a shop floor full of raw metrics without defined targets gives you data — not decisions.
How do you track manufacturing KPIs in real time?
Real-time KPI tracking requires automated data collection from machines (not manual entry), integration between machine data and ERP job context, and a dashboard that refreshes continuously. Platforms like Harmoni combine CNC machine data, ERP work order data, and operator inputs into a single live view, shifting the dashboard from a post-shift report into an active production tool.