That gap has a real cost. Idle machines don't pause your overhead, labor expenses, or fixed costs — they just stop producing output to cover them. Most shops only discover the problem after it's already compressed margins, pushed out delivery dates, or created friction with customers who expected on-time parts.
This article covers what machine utilization actually means, how to calculate it correctly, what drives it down, and how to improve and track it in a way that produces real operational change.
Key Takeaways
- Machine utilization measures the share of scheduled time a machine spends doing productive work — and for most shops, the real number is far lower than assumed
- The standard formula is: (Productive Machine Hours ÷ Scheduled Machine Hours) × 100 — but choosing the right denominator matters as much as the math
- Low utilization usually traces to overlapping causes: unplanned downtime, long changeovers, scheduling gaps, and operator idle time
- Improving utilization rarely requires new equipment — better visibility into existing machines and people is what actually moves the number
- Real-time tracking turns utilization from a lagging report into an actionable management tool
What Is Machine Utilization and How Do You Calculate It?
Machine utilization is a performance ratio: it measures how much of a machine's scheduled production time is spent doing productive work. That gap between actual and potential output directly affects capacity, profitability, and your ability to commit to customer delivery dates with confidence.
The Machine Utilization Formula
The standard formula:
(Productive Machine Hours ÷ Scheduled Machine Hours) × 100
Two quick examples:
- Single-shift operation: 8 hours scheduled, 6 hours productive = 75% utilization
- 24/7 facility: 168 hours scheduled per week, 110 hours productive = 65.5% utilization
Both examples use the same math. The difference is what you define as "scheduled."
Choosing the Right Time Basis
"Scheduled hours" is not the same as calendar hours. If your facility runs five days a week and shuts down on weekends, your denominator should reflect that — not 168 hours. Using calendar hours as the base artificially deflates your rate and obscures what's actually happening during production time.
Consider a shop running two shifts, five days a week: 80 scheduled hours, 55 productive. That's 68.75% utilization. Report the same data against 168 calendar hours and the rate drops to 32.7% — technically accurate, operationally useless.
| Basis | Hours Used | Utilization Rate |
|---|---|---|
| Scheduled (two-shift, 5-day) | 55 of 80 hrs | 68.75% |
| Calendar (168 hrs/week) | 55 of 168 hrs | 32.7% |
The same shop, the same week, two completely different numbers.
Define your denominator explicitly. Document what it includes and excludes. Otherwise your rate will shift whenever someone changes the calculation basis, making trend analysis unreliable across reporting periods.
What Actually Counts as "Productive" Time?
Not all "running" machine time is equal. There are three distinct layers:
| Layer | What It Measures |
|---|---|
| In-cycle time | Machine control reports the machine is actively executing a program |
| Spindle-rotating time | Spindle is turning — not all machines expose this signal |
| In-cut time | Machine is actually removing material; narrower than spindle rotation |

Which layer you measure changes how you interpret the number and where you look for improvement. A machine showing 70% in-cycle time but only 40% in-cut time has a very different problem than one showing 40% in both.
What Is a Good Machine Utilization Rate?
The commonly cited "80% world-class" threshold belongs to OEE (Overall Equipment Effectiveness), not utilization alone. Applying it directly to utilization sets an unrealistic target.
The data puts this in perspective. MachineMetrics' benchmarking data from more than 1,000 CNC machines averaged 28.8% utilization. The 2022 data showed many companies clustered at 17–20%, with a smaller high-performing tail. Typical discrete manufacturing utilization falls in the 20–40% range.
That doesn't mean 30% is your target. Your first job is to measure accurately, establish your own baseline, and pursue steady gains without chasing an arbitrary ceiling.
Why 100% is the wrong goal:
- No room for changeovers or preventive maintenance
- Forces reactive repairs instead of planned ones
- Eliminates capacity for process improvement
- Creates fragility; any unplanned stop immediately cascades
Why "good" depends on your production type:
- A high-volume CNC shop running the same part family across long runs can sustain much higher utilization than a precision job shop making one-of-a-kind aerospace components
- High-mix, low-volume environments carry inherently higher setup ratios and more frequent changeovers, so targets must reflect that reality
- No single threshold applies across all shop types
The more productive question: what's your baseline, and what specific losses are pulling you below it?
What Causes Low Machine Utilization?
Low utilization rarely has a single cause. Most shops are losing time across several categories simultaneously, which is why the aggregate number looks so bad.
Unplanned Downtime
Equipment failures pull machines offline at the worst possible moments. The production loss isn't just the repair time — it's also the wait for a technician, the search for replacement parts, and the approval chain before anyone can begin the fix.
NIST research found that facilities in the highest reactive-maintenance quartile experienced roughly 3.3 times the downtime of those in the lowest quartile.
Changeover and Setup Time
Every minute spent setting up the next job is a minute the machine isn't cutting. Without standardized setup procedures, changeover times balloon unpredictably. A 2022 study applying SMED methodology to a 17-machine turning line reduced setup time from 65.30 minutes to 23.62 minutes — without capital investment. At scale, that kind of reduction compounds significantly across a full shift.

SMED (Single-Minute Exchange of Die), developed through work associated with Toyota, separates setup into:
- Internal steps — must be done while the machine is stopped
- External steps — can be done while the machine is still running
Converting internal steps to external wherever possible is the core mechanism.
Production Planning and Scheduling Gaps
When a machine finishes its current run and the next job isn't queued and ready, every minute between operations becomes utilization loss. Common culprits:
- Materials not staged before the current job ends
- Jobs not prioritized or sequenced in the shop floor schedule
- Operators not briefed on what comes next
- ERP schedules that don't reflect real-time shop floor status
Operator-Related Losses
These operator-driven losses reduce machine uptime without triggering a "downtime" event in most tracking systems:
- Late starts and early stops at shift boundaries
- Idle time between operations while waiting for the next job
- Unclear job sequences that leave operators without direction
Because the machine never reported a fault, the time loss goes completely unrecorded. In shops that track only machine signals, this is a significant blind spot.
Process Errors and Rework
Scrap and defective parts consume machine time without contributing to good output. A machine running parts that will be scrapped counts those hours as "active" in a raw utilization calculation — but the effective output is zero. Every scrapped part represents machine time you can't recover.
How to Improve Machine Utilization
Before any improvement initiative: measure first. An imperfect baseline is still better than assumptions. Without a documented starting point, you can't determine whether a change actually worked or just got lost in the noise.
Prevent Unplanned Downtime
The maintenance strategy you use has a measurable impact on availability. NIST found that facilities relying more on preventive and predictive maintenance had 52.7% less unplanned downtime than more reactive comparison groups.
The three tiers:
- Reactive maintenance — highest cost and disruption; you're always responding, never ahead
- Preventive maintenance — scheduled service by time or usage intervals; reduces surprises but doesn't catch early-stage degradation
- Predictive maintenance — condition-based monitoring that flags degradation before failure; most effective, but requires data infrastructure to run

Scheduling maintenance during planned low-demand periods — weekends, between shifts, during production changeovers — costs far less than an emergency repair that halts a mid-run operation.
Reduce Changeover Time
Apply SMED principles to separate what must happen with the machine stopped from what can happen while it's still running. Practical steps:
- Document the current setup sequence — time each step to find where time actually goes
- Identify external-convertible steps — tooling prep, program verification, fixture staging
- Standardize what remains internal — create documented procedures so each setup is repeatable
- Stage materials and tooling in advance — nothing should be retrieved after the machine stops
None of these steps require capital investment. The 65-to-23-minute reduction in the SMED case study came entirely from process discipline.
Tighten Production Scheduling
The goal is zero gap time between jobs. That requires:
- Jobs queued and confirmed before the current run ends
- Materials staged at the machine, not still in the warehouse
- Operators briefed on what's next before they finish what's current
- Real-time schedule visibility so managers can act on delays, not just report them
When ERP schedules and shop floor reality are disconnected — different systems, manual updates, end-of-day reconciliation — the gap between them becomes idle time that doesn't appear in any report.
Close the Operator Accountability Gap
Operators directly affect machine uptime. Without real-time feedback, they have no way to know whether they're winning or losing the day against utilization targets. Visual management tools and shop floor scoreboards change that dynamic: when performance is visible, behavior shifts.
This is where Harmoni's factory orchestration platform addresses a gap that machine-signal-only monitoring leaves open. Using long-range RFID, Harmoni automatically detects which employees are near which machines and which jobs are active. Each workcenter gets a command center showing:
- Current job status and work instructions
- Performance against ERP targets in real time
- Operator-driven gaps — a machine stopped without a recorded reason, a job not yet started
Managers see these issues while they're still happening, not after the shift ends.
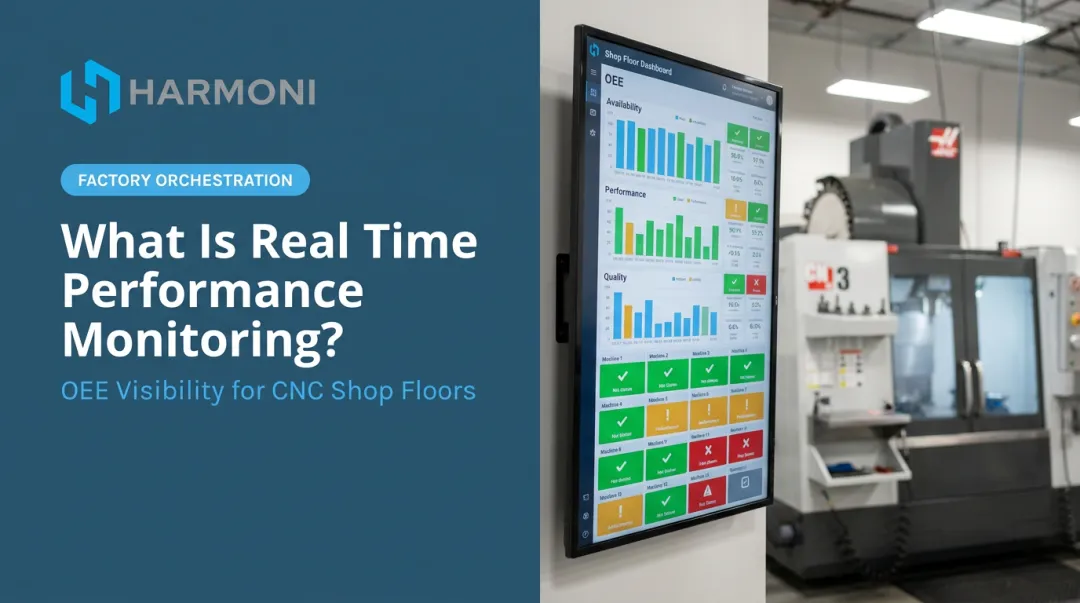
That same visibility extends to the floor itself. Harmoni's Visual Factory module uses high-intensity andon-style indicator lights to broadcast live OEE conditions across the shop floor, so machine status is visible to everyone without checking a screen.
How to Track Machine Utilization in Real Time
Manual tracking (paper logs, spreadsheets, end-of-shift operator reports) captures what operators choose to record, not what actually happened. The result is data that's biased toward good outcomes, delayed by hours, and blind to events that didn't feel worth noting at the time. Decisions built on that data reflect assumptions dressed up as reporting.
What real-time utilization tracking needs to do:
- Capture machine state automatically, without operator input
- Correlate machine signals with operator activity (not just machine-on/machine-off)
- Integrate with ERP and scheduling systems so utilization data has operational context
- Surface problems while there's still time to act — not in a post-shift summary
Harmoni's platform goes beyond machine-only monitoring by combining three data streams: machine signals from connected CNC controls (Mazak, Haas, Fanuc, Heidenhain, Siemens, DMG MORI, Makino, Fadal), operator RFID activity, and live ERP job data. That combination allows managers to see not just that a machine stopped, but whether an operator is present, what job should be running, and whether that job is on pace against its ERP target.
The practical result: a job running long is visible as it happens. An operator idle between operations shows up before it becomes an hour of lost time. A machine that stopped without a recorded reason triggers a flag rather than disappearing into a gap in the daily report.

These outcomes show up in practice. WessDel, an aerospace and defense components manufacturer, gained 17 productive hours per employee per month after deploying Harmoni — by eliminating manual ERP transaction time that was consuming 11 minutes per transaction throughout each operator's shift.
Machine Specialties, Inc. (MSI), a high-precision aerospace, defense, and medical manufacturer, used Harmoni's Epicor ERP integration to nearly eliminate part count errors and shift from spindle time tracking to earned hours, giving management clearer profitability insight per job.
Frequently Asked Questions
What is the meaning of machine utilization?
Machine utilization is a performance ratio that measures how much of a machine's scheduled production time is spent on productive work. It's a direct indicator of factory efficiency, and the gap between assumed and actual utilization is typically larger than most shops expect.
How do you calculate machine utilization?
The formula is: (Productive Machine Hours ÷ Scheduled Machine Hours) × 100. For example, if a machine has 8 scheduled hours and runs productively for 6, utilization is 75%. The denominator should reflect actual scheduled time, not total calendar hours.
What is the difference between machine utilization and OEE?
Utilization (or availability) measures whether the machine was running during scheduled time. OEE goes further: it multiplies availability by performance (speed losses) and quality (defect losses), making it a more comprehensive metric. Note that the commonly cited 85% world-class benchmark applies to OEE, not utilization alone.
What is a good machine utilization rate?
Industry data puts average CNC utilization in the 20–40% range, with many shops clustering below 30%. The right target depends on production type, mix complexity, and your specific loss profile. Establish your baseline first, then focus on incremental improvement.
What are the main causes of low machine utilization?
The most common culprits are unplanned downtime, excessive changeover and setup time, scheduling gaps that leave machines idle between jobs, operator idle time between operations, and quality losses from scrap or rework that consume machine time without producing good output.
How often should machine utilization be measured?
Real-time or shift-level tracking is best for operational decisions, since it lets you catch problems while there's still time to act. Weekly and monthly rollups support trend analysis and improvement planning. Relying on monthly reports alone means in-shift problems go unaddressed for weeks.