Mid-to-large manufacturers in CNC machining, aerospace, automotive, defense, and healthcare feel this pressure most acutely. US manufacturing could need 3.8 million net new workers between 2024 and 2033, with as many as 1.9 million positions going unfilled if the skills gap persists, according to a 2024 study cited by the National Association of Manufacturers. Fewer hands on the floor means every hour of production has to count.
Much of the hidden loss isn't from bad operators or old machines. It's from disconnected systems: ERP, MES, machines, and people all working in silos. This guide breaks down what production efficiency actually means, why it matters, how to measure it, and the strategies — including real-time shop floor orchestration — that close the gap.
Key Takeaways
- Efficiency means less waste, not more output — track it, don't guess
- A focused set of KPIs (OEE, throughput, labor utilization) beats tracking everything
- Bottleneck removal, standardization, automation, and visibility compound together
- Skip shortcuts: overproduction and speed-over-quality trade-offs erase gains fast
What Is Manufacturing Production Efficiency?
Production efficiency measures how close your actual output comes to the maximum possible output, using the least time, labor, and material along the way. The goal is smarter operation, not simply running machines harder.
The formula is straightforward:
Efficiency (%) = (Actual Output / Maximum Possible Output) x 100
Worked example: A CNC cell capable of producing 100 parts per shift actually produces 82 good parts. That's an efficiency rate of 82%, meaning 18% of theoretical capacity was lost to downtime, scrap, changeovers, or slow cycles.
Efficiency vs. Productivity vs. Effectiveness
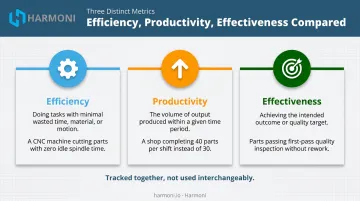
These three terms get used interchangeably on the shop floor, but they measure different things:
- Efficiency: minimizing waste while producing output (doing things right)
- Productivity: total output volume relative to input, regardless of waste (how much you make)
- Effectiveness: whether you're hitting the right goals at all (doing the right things)
A shop can be highly productive and still inefficient: think of a machine cranking out parts at high volume while burning through excess material and rework. Efficiency is most valuable when tracked consistently over weeks and months alongside other KPIs, not as a one-off snapshot pulled for a single report.
Why Improving Production Efficiency Matters
Efficiency gains hit the bottom line directly. Every hour a machine sits idle, every part that gets scrapped, and every rework cycle adds cost without adding value.
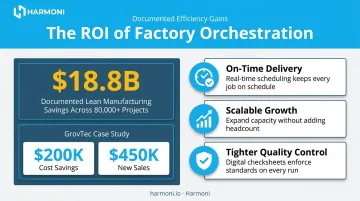
According to NIST's Lean and Process Improvement program, the Manufacturing Extension Partnership has tracked more than 80,000 lean manufacturing projects. Those projects have produced over $18.8 billion in documented manufacturer savings, proof that structured efficiency work pays off at scale.
One aerospace/defense contract manufacturer, GrovTec US, used value-stream mapping to reorganize its quality control and shipping flow. The result: $200,000 in cost savings and $450,000 in new sales from freed-up capacity, per the same NIST reporting.
Beyond cost, efficiency drives:
- On-time delivery consistency: critical in aerospace and defense, where supplier performance reviews under AS9100 cover both conformity and delivery timing
- Scalable growth: efficient shops absorb complex, higher-mix jobs without adding headcount proportionally
- Tighter quality control: fewer surprises mean fewer traceability headaches during audits
For regulated industries especially, efficiency directly supports quality: tighter processes reduce the errors that trigger audit findings and nonconformance reports.
Key KPIs to Measure Production Efficiency
You can't improve what you don't measure, but tracking too many metrics is its own trap. Pick a small set tied to strategic goals, then go deep.
Overall Equipment Effectiveness (OEE)
OEE combines three factors into one score:
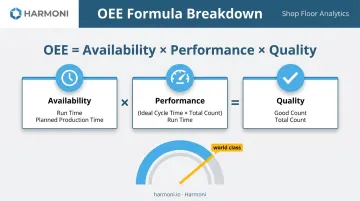
OEE = Availability x Performance x Quality
- Availability: Run Time / Planned Production Time
- Performance: (Ideal Cycle Time x Total Pieces) / Run Time
- Quality: Good Pieces / Total Pieces
Factory orchestration platforms like Harmoni pull these three inputs directly from machine data, so Availability, Performance, and Quality update automatically instead of getting tallied by hand at the end of a shift.
Many industry references cite 85% OEE as world class for discrete manufacturing, though Vorne's OEE research notes that shops new to OEE tracking often start well below that. The number matters less than the trend line: is it moving up?
Throughput, Cycle Time, and Quality Yield
- Cycle time is the actual time to process one unit
- Throughput is units completed over a defined time window
- First Pass Yield = Usable parts without rework / Total parts built x 100
- Scrap Rate = Unusable parts / Total parts built x 100
Example: cutting cycle time from 12 minutes to 9 minutes per part on a 3-machine cell adds nearly 33% more capacity, with zero added labor.
These quality metrics expose inefficiency hiding behind "output" numbers. A part that gets reworked twice before passing inspection still counts as "produced," but it consumes three times the resources.
Labor Utilization and Downtime Tracking
Tracking actual operator time against specific jobs, rather than relying on estimates, reveals wasted time between operations and produces far more accurate true job costs. Estimate-based costing tends to hide the gap between what a job was supposed to take and what it actually took.
Split downtime into planned (maintenance, changeovers) and unplanned (breakdowns, material shortages). A 2017 Vanson Bourne survey found that operator error caused 23% of unplanned downtime in manufacturing, more than double the rate in other sectors. Root cause visibility tells you why downtime happened. That's more useful than the raw percentage alone.
Pick 3-5 KPIs tied to the problem you're actually trying to fix. Chasing every metric available just creates noise.
Proven Strategies to Improve Manufacturing Production Efficiency
Identify and Eliminate Bottlenecks
Bottlenecks rarely announce themselves. Use a mix of methods to find them:
- Operational data analysis: spot where WIP piles up or cycle times spike
- Gemba walks: observe the actual process on the floor instead of relying on reports
- Value stream mapping: diagram every step from order to delivery to expose hidden delays
Material shortages, unplanned downtime, and operator unavailability are the usual culprits behind broken flow.
Standardize Processes with SOPs
Documented, consistent procedures reduce variation across multi-machine, multi-operator CNC environments. When every operator runs a job the same way, using the same setup steps and inspection points, output becomes predictable and defects drop.
Digital work instructions and standardized checksheets help this stick, since they put the correct procedure in front of the operator at the point of use rather than buried in a binder.
Apply Lean and Continuous Improvement Tools
Start small. Three tools cover most of the ground:
- 5S: Sort, Straighten, Shine, Standardize, Sustain
- Kanban: pull-based signaling to control inventory and flow
- Just-In-Time (JIT): produce only what's needed, when it's needed
These target the eight wastes of lean: defects, overproduction, waiting, non-utilized talent, transportation, inventory, motion, and extra processing. Rolling out all three at once tends to overwhelm operators. Introduce one, build the habit, then layer on the next.
Automate Repetitive and Non-Value-Add Tasks
Manual data entry, part counting, and reporting eat hours that never show up on a job cost. Automating these tasks frees operators for actual production work and cuts human error.
Real-world example: one shop's time-tracking process dropped from 11 minutes per transaction to just seconds after automation, recovering roughly 17 productive hours per employee per month.
Gain Real-Time Visibility and Orchestrate the Shop Floor
This is where most efficiency programs stall. Even with good SOPs and lean training, losses keep happening because ERP, MES, machines, and operators aren't coordinated in real time. A job finishes on the shop floor, but the ERP doesn't know for another shift. An operator waits for a program that should've loaded automatically.
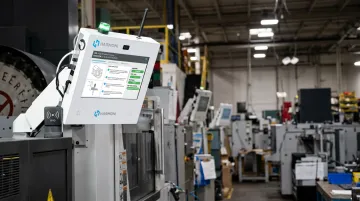
This is the gap Harmoni's factory orchestration platform is built to close. It sits between ERP/MES systems and CNC machines (including Haas, Mazak, DMG Mori, Fanuc, Siemens, Heidenhain, and Makino controls), using long-range RFID to detect the operator and job at each workcenter automatically.
What that looks like in practice:
- Automated program loading: programs, settings, and tool offsets load automatically once RFID confirms the job and operator, cutting wrong-program scrap
- A command center at each workcenter: gives operators digital work instructions and checksheets right where they're working
- Real-time problem detection: issues get caught as they happen, not discovered after a full shift of scrap
- Accurate job costing: machine cycle time and operator labor data feed ERP job costing automatically, replacing estimate-based guesswork
One aerospace, defense, and medical manufacturer using this approach nearly eliminated part count errors across its shop floor after full deployment. It's the kind of improvement that often goes unnoticed until you check the scrap report six months later.
Invest in Workforce Training and Engagement
Technology alone doesn't fix efficiency. Operators need to understand why a change is happening, not just be told to follow a new procedure.
Ongoing training reduces turnover and surfaces improvement ideas from the people who actually run the machines every day. They usually know where the real bottleneck is before any dashboard shows it.
Common Efficiency Traps to Avoid
Not every "efficiency win" is actually one. Watch for these traps:
- Overproduction disguised as efficiency: running machines at full tilt to hit output numbers creates excess inventory, not value. Lean practitioners consider it the worst waste because it feeds the other seven.
- Chasing speed without quality controls: pushing cycle times down without tightening inspection increases scrap and rework, which cancels out any speed gained.
- Rolling out initiatives without operator buy-in: new tools or SOPs introduced top-down, without training or explanation, tend to produce burnout and resistance rather than adoption.
Shortcuts create an illusion of speed that rarely survives the next shift change. Lasting efficiency comes from operators who understand why a process changed, backed by real floor-level visibility.
Frequently Asked Questions
How can production efficiency be improved?
Efficiency improves through bottleneck elimination, standardized processes, automation of manual tasks, real-time shop floor visibility, and ongoing workforce training. These work best combined rather than applied in isolation.
What does production efficiency mean?
Production efficiency is the ratio of actual output to maximum possible output, achieved with minimal waste of time, labor, and materials. It's calculated as (Actual Output / Maximum Possible Output) x 100.
What are the 5 P's of production?
The 5 P's commonly referenced in production management are People, Plant, Parts, Processes, and Programs/Planning. Each factor interacts with the others, and weakness in any one can drag down overall efficiency.
What is a good OEE score for manufacturers?
85% or higher is generally cited as the benchmark for top-tier OEE for discrete manufacturing. Many shops operate well below that, especially early in tracking — the goal should be steady improvement against your own baseline, not chasing an absolute number.
What's the difference between efficiency and productivity?
Efficiency focuses on minimizing resource waste while producing output. Productivity focuses on total output volume relative to input, regardless of how much waste occurred along the way.
How do you calculate production efficiency?
Use the formula: (Actual Output / Maximum Possible Output) x 100. For example, producing 82 good parts out of a possible 100 gives an efficiency rate of 82%.