Introduction
Most manufacturers today have more data available than ever before — yet production decisions still get made from shift-end reports, supervisor memory, and best guesses reconstructed hours after the fact. The gap between data captured and data acted on is exactly where production losses compound. A stoppage that happened at 7 AM doesn't reach a corrective action until 3 PM. By then, the shift is over.
Real-time manufacturing data collection closes three specific blind spots: what machines are actually doing, what operators are actually doing, and whether shop floor activity is tracking with what the ERP planned. Without all three, you have visibility into equipment — but not into production.
Closing those blind spots starts with understanding the full data chain. This guide covers what data to collect, how it moves from source to decision, and what separates manufacturers who gain real operational insight from those who accumulate dashboard noise they never act on.
Key Takeaways
- Real-time data collection captures machine, operator, and job events as they happen, not hours later in a shift report
- The most actionable data combines three streams: machine performance, operator activity, and ERP job progress
- All three streams must connect in a unified view; monitoring any single stream in isolation leaves blind spots
- Common pitfalls include machine-only deployments that ignore the operator layer, and dashboards with no assigned alert owners
- Measurable outcomes include reduced downtime, accurate job costing, faster scrap detection, and consistent shop floor execution
What Is Real-Time Manufacturing Data Collection?
Real-time manufacturing data collection is the automated capture of production data — from machines, operators, and business systems — as events occur on the shop floor.
The contrast with batch reporting is stark. Traditional shift-end summaries introduce 8–12 hours of blind spots before anyone can act. By the time a supervisor reads that report, the machine that ran at 60% utilization all morning has already cost the facility hours of recoverable capacity.
Monitoring vs. Orchestration
These two terms get mixed up constantly, and the distinction matters more than most manufacturers realize.
| Monitoring | Orchestration | |
|---|---|---|
| What it does | Records run states, cycle times, and downtime events | Uses live data to coordinate machines, operators, and workflows |
| Role | Passive — observes and reports | Active — flags deviations, routes information, prevents problems |
| Outcome | Visibility into what happened | Prevention of problems before they compound |
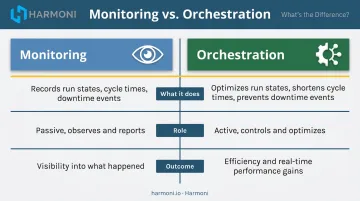
When a system knows which job is running, who is running it, and how the machine is performing against ERP targets, it can act — not just report.
Harmoni's factory orchestration platform draws this line explicitly: monitoring is a capability within orchestration, specifically within the Observability pillar. The broader platform also includes Automation (eliminating manual steps and paperwork) and Process Control (managing work instructions, CNC programs, and engineering revisions at the point of use). A dashboard-only tool cannot do either.
Why This Is Urgent Now
McKinsey's 2019 discrete-manufacturing study found that while 68% of manufacturers viewed Industry 4.0 as a top strategic priority, only 29–30% were capturing value at scale. An IndustryWeek survey put a finer point on it: 20% of manufacturers frequently made poor decisions because data was missing, inaccessible, or untrusted.
The data exists on most shop floors. The gap is in getting it to the right person fast enough to change the outcome.
Key Data Categories to Collect on the Shop Floor
Not all shop floor data is equally actionable. Five categories drive the most meaningful decisions.
Machine Performance Data
Machine performance data includes run state (active/idle/down), cycle times, spindle utilization, output counts per cycle, and the three OEE components: Availability, Performance, and Quality.
One critical point: this data must be captured continuously, not polled at intervals. OEE reconstructed from interval snapshots reflects an estimate of what happened — not what actually happened. Continuous capture is the difference between knowing your true utilization and believing a number that looks better than reality.
How it's sourced:
- Modern CNC controllers: direct integration via MTConnect (for compatible CNCs) or OPC-UA (for PLCs and SCADA systems)
- Legacy machines: edge devices and sensors at the I/O level capture equivalent signals without requiring controller replacement or PLC reprogramming
Harmoni connects natively to Mazak/Mazatrol, Haas/NGC, Fanuc 0i/30i/31i/32i, Heidenhain, Siemens/Sinumerik, DMG MORI, Makino, and Fadal controllers — and deploys without machine replacement regardless of equipment age.
Operator Activity Data
Operator activity data is the most commonly missing layer in shop floor visibility — and without it, machine data loses much of its diagnostic value.
Machine sensors track equipment behavior. They cannot record who ran a job, how long setup took, when an operator was pulled to another workcenter, or whether the correct work instructions were followed. All of those factors directly affect true labor efficiency and job costs.
Operator activity is captured through:
- RFID-based automatic check-in at workcenters (Harmoni uses long-range RFID to detect operator presence and job identity simultaneously)
- Digital job clock-in/out replacing manual time sheets
- Task-level logging that creates a timestamped, traceable record of operator-to-job assignments
Without this layer, a 20% OEE gap on a machine has no human context. You know the machine underperformed — you don't know why.
Quality and Defect Data
Quality data includes first-pass yield, scrap counts, rework reasons, and real-time deviation flags from quality stations or operator inputs. The goal is to log defects at the point of occurrence rather than discovering them downstream.
When defect data links to the specific machine, operator, and job in real time, root cause analysis that previously took days takes minutes. The question "which operator, on which job, at which machine, during which shift" has an immediate answer.
Downtime and Stoppage Data
Manual downtime logs have a structural flaw: they systematically miss micro-stoppages under two minutes. Those brief stops are individually invisible but collectively significant — they add up across a shift without ever appearing in a supervisor's log.
Automated capture works through reason codes logged at the workcenter, either automatically triggered by machine state change or entered by the operator at the moment of stoppage. This creates a structured downtime record that supports Pareto analysis and targeted corrective action — not a vague "machine was down" entry reconstructed from memory at shift end.
Job and Order Progress Data
This is the layer that connects shop floor reality to ERP-planned schedules. It covers:
- Actual units completed vs. planned
- Job routing progress through operations
- Real-time comparison of actual machine and labor time against the estimated standard
The job costing impact is direct. Harmoni captures actual machine cycle time and operator labor time against each specific job and operation, then benchmarks performance against how long the cycle was estimated to take in the ERP — not against a theoretical machine maximum.
When a job runs exactly as quoted, that reads as 100% performance. That framing directly supports quoting accuracy and profitability analysis in a way a generic efficiency score never does.
How Real-Time Manufacturing Data Flows From Source to Insight
Raw machine signals don't become decisions on their own. They travel through four layers before reaching the people who need to act on them.
Layer 1 — Collection at the Source
Sensors, PLCs, CNC controllers, and RFID devices capture raw signals at the machine and workcenter level. Standard protocols govern transmission without interrupting production:
| Protocol | Primary Use |
|---|---|
| MTConnect | CNC machine data in a standardized semantic format |
| OPC-UA | PLCs, SCADA systems, machine-to-enterprise communication |
| MQTT | Lightweight IIoT streaming for high-frequency sensor data |
Read-only edge connections protect machine control networks from data traffic — the production system is never exposed to the data collection layer.
Layer 2 — Edge Processing and Structuring
Raw signals are processed near the source and enriched with metadata before transmission: machine ID, operator ID, job number, and timestamp. This tagging step is what makes every event traceable.
A cycle time reading without that context is just a number. With it, that same reading connects to a specific operator, job, part number, and moment in time — enabling OEE accuracy and fast root cause analysis.
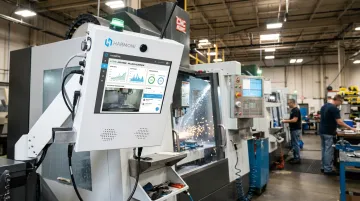
This enrichment happens at the workcenter level. Harmoni's terminal connects directly to the machine, detects the operator and job via RFID, and structures data locally before it flows to any backend system.
Layer 3 — The Orchestration Layer
This is the gap most monitoring tools leave open. Raw machine data and ERP systems don't speak the same language — data must be interpreted, routed, and synchronized across machines, operators, and business systems before it becomes actionable.
A factory orchestration platform like Harmoni sits here, combining machine data with operator activity and ERP job workflows into a single, unified picture of what is happening on the floor and whether it matches what was planned. Without this layer, machine data and ERP data remain separate, and the question "are we on track?" still requires a human to reconcile two systems manually.
Layer 4 — Visualization and Alerting
Processed data feeds role-specific views:
- Operators see live job status, OEE indicators, work instructions, and quality inputs at their workcenter terminal
- Supervisors see multi-machine dashboards with active downtime events, labor productivity, and bottleneck visibility
- Management sees OEE trends, production-vs-plan metrics, and job costing data — accessible from any device, not just the shop floor
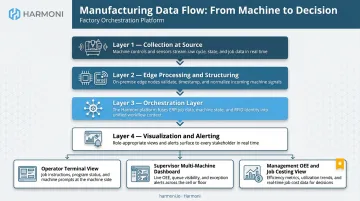
Automated alerts push to the right person at the moment a threshold is breached. Text and email notifications route to assigned owners immediately — not at shift end.
From Data to Decisions: How Real-Time Insights Drive Manufacturing Outcomes
Real-Time OEE Tracking
Live OEE is calculated continuously from all three data streams: Availability from machine run/down states, Performance from cycle times vs. the ERP-quoted standard, Quality from defect logs entered at the point of occurrence.
OEE.com cites 85% as the commonly referenced world-class threshold, built on 90% availability, 95% performance, and 99.9% quality. Most manufacturers operate well below that — and shift-end OEE reconstruction from operator notes makes the gap harder to close, because the numbers are subject to memory error and reporting bias. Continuous capture removes that variable.
Predictive Maintenance and Early Anomaly Detection
When the data stream is continuous and structured, machine behavior drift becomes visible before it becomes a failure. Cycle time creep, temperature spikes, and vibration anomalies show up as trends — not as surprises. McKinsey's 2022 Industry 4.0 analysis found 30–50% reductions in machine downtime across manufacturing use cases — results that are only achievable when data is continuous rather than reconstructed.
Accurate Job Costing
Real-time capture of machine time and operator time, linked to specific jobs, produces actual cost-per-job data that replaces estimates. Machine Specialties, Inc. (MSI), a high-precision aerospace and defense manufacturer with over 300 employees, shifted from tracking spindle time to tracking earned hours after implementing Harmoni with their Epicor ERP — giving them clearer profitability insight and eliminating paper travelers.
Actual costs flow back into the ERP automatically, with no manual entry. That closed loop directly supports quoting accuracy: estimators can refine future quotes based on what jobs actually cost, not what they were modeled to cost.
Prevention of Errors and Consistent Execution
When the system knows which job is running, who is running it, and what the machine is doing, it can flag deviations immediately. Harmoni surfaces the right work instructions, drawings, and CNC programs for each specific part, revision, and operation automatically — based on the detected job and machine. That means:
- Operators can't pull up an outdated revision by mistake
- Program changes require approval before they're set as current
- Quality drift appears graphically at the workcenter terminal before it becomes scrap
Process control is embedded in the data flow, enforced in real time rather than documented after the fact.
Implementation Considerations and Common Pitfalls
Avoid the Machine-Only Blind Spot
The most common deployment mistake: machine monitoring without the operator and job layers. The result is visibility into equipment behavior with no understanding of why OEE gaps exist.
Without those layers, three critical data streams stay invisible:
- Labor time — who was at the machine and when
- Setup time — how long changeovers actually take vs. planned
- Job routing — whether the right work order is running on the right workcenter
You can see that a machine ran at 65%, but you can't determine whether the cause was a setup delay, an operator pulled to another workcenter, or a scheduling mismatch.
Effective real-time data collection connects all three streams. Getting that connection right starts with where — and how small — you begin.
Start Focused, Scale Deliberately
Begin with a single line or workcenter. Choose a small number of high-impact metrics:
- Downtime reasons on your most critical machine
- OEE on a bottleneck operation
- Job progress on your highest-volume work order
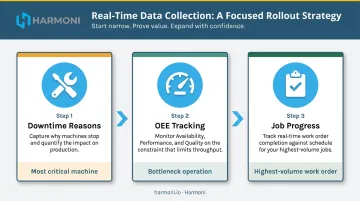
This approach validates data accuracy, builds operator trust, and demonstrates ROI before a full-floor rollout. McKinsey's deployment guidance recommends a prioritized rollout with a minimal viable architecture — don't wait for a perfect IT/OT environment before starting.
Assign Alert Owners Before Go-Live
A common reason real-time monitoring deployments fail to deliver value is organizational, not technical. When alerts have no assigned owner and operators aren't trained on what the data means, dashboards become wallpaper — visible but ignored.
Before the system goes live, define:
- Alert thresholds for each metric
- Who owns each alert type (supervisor, maintenance, engineering)
- Escalation path if the first owner doesn't respond
- What action is expected within what timeframe
Getting this structure in place before go-live is what separates deployments that drive change from those that generate reports nobody reads.
Frequently Asked Questions
What types of data are collected in real-time manufacturing systems?
The three primary streams are machine performance (run states, cycle times, OEE components), operator activity (labor time, job assignments, setup events), and job/order progress (actual vs. planned units, quality logs, real-time job routing). All three must connect for the data to be fully actionable.
How does real-time data collection reduce manufacturing downtime?
Capturing stoppages and micro-stoppages in real time — with reason codes assigned immediately — lets teams spot patterns before they compound. Structured Pareto analysis of those causes is what shifts maintenance from firefighting to prevention.
Can real-time data collection systems work with legacy CNC machines?
Yes. Edge devices connect via I/O signals — contact closures, current transducers, or Ethernet ports — using read-only protocols that capture state data without PLC reprogramming or machine replacement. Harmoni deploys to existing equipment regardless of age or controller type.
What is the difference between machine monitoring and factory orchestration?
Machine monitoring tracks individual equipment performance — run states, cycle times, OEE. Factory orchestration combines that machine data with operator activity and ERP job workflows to actively coordinate people, systems, and processes in real time. The distinction is scope: monitoring gives you visibility, while orchestration uses that visibility to drive better decisions and outcomes.
Which database is best for real-time manufacturing data?
Time-series databases — such as InfluxDB or TimescaleDB — are purpose-built for high-frequency, timestamped machine data. Cloud data warehouses handle aggregated production analytics and historical reporting. Most production environments use both, for different use cases.
What are the top real-time data movement tools in manufacturing?
MTConnect standardizes CNC machine data; OPC-UA handles PLCs, SCADA, and machine-to-enterprise communication; MQTT serves lightweight IIoT streaming at high frequency. A factory orchestration platform routes data from all three into the MES or ERP systems where production decisions get made.