Introduction
Manufacturers today operate under conditions that leave little room for delayed information. Customer expectations are tighter, margins are narrower, and production complexity has grown to the point where an end-of-shift report is often too late to act on.
Real-time data gets plenty of attention in manufacturing conversations, but its actual value shows up on the shop floor: in how quickly a defect is caught, how accurately a job is costed, and how consistently operators execute from start to finish.
The gap between talking about real-time visibility and actually using it to make decisions is where most manufacturers leave efficiency on the table.
This article explains the specific, measurable advantages real-time data delivers for production efficiency. Not abstract potential — the day-to-day operational impact that separates a facility running at 75% OEE from one consistently hitting 85% or higher.
Key Takeaways
- Real-time data replaces reactive firefighting with in-process correction — catching defects and deviations before they compound into scrap or missed deliveries
- Unified visibility across machines, operators, and ERP workflows closes the efficiency gaps hiding in handoffs between these layers
- Eliminating non-productive operator tasks — setup searches, manual paperwork, waiting for instructions — directly adds capacity to every shift
- Facilities without real-time data face structurally higher costs: inaccurate job costing, excessive rework, and downtime that goes unaddressed too long
- The value compounds over time as patterns surface, processes tighten, and teams make decisions from shared, accurate data
What Is Real-Time Data in Manufacturing?
Real-time data in manufacturing is the continuous capture and presentation of production information — machine status, cycle times, operator activity, job progress — at the moment events occur, rather than hours later when a shift ends or a report is generated.
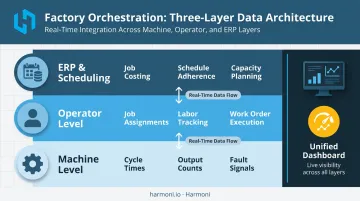
It operates at three levels:
- Machine level — cycle time, output count, status signals, and fault conditions captured directly from machine controllers
- Workcenter level — operator activity, job assignments, quality checksheet completion, and setup confirmation as operators interact with the system
- Aggregate level — dashboards and alerts that surface performance across jobs, shifts, and facilities for supervisors and managers
Purpose is what separates real-time data from standard reporting. Real-time data exists to close the gap between planned production and actual production — not as a technology goal in itself, but as a tool for intervention.
When a job is scheduled to run 200 parts in eight hours and you can only see that figure at shift end, there's no opportunity to course-correct. When you can see it at the two-hour mark, there is.
Key Advantages of Real-Time Data for Production Efficiency
The advantages below are grounded in operational outcomes manufacturers actively track: cost, throughput, quality, error rates, and resource utilization. Each advantage is most powerful when real-time data is acted upon consistently — not just collected and stored.
Advantage 1: Catch Problems While They're Happening, Not After the Damage Is Done
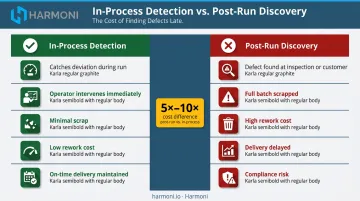
The core shift here is from discovery-after-the-fact to in-process correction. When a defect, machine fault, or process deviation is visible as it occurs, the cost of that event drops significantly compared to discovering it at inspection or after a full production run.
Continuous monitoring of cycle times, output counts, and machine signals generates immediate alerts when performance deviates from standard. That alert gives operators and supervisors a window to intervene before a minor issue becomes a full batch of scrap or a missed delivery.
Why it matters financially: APQC data reports that scrap and rework costs represent approximately 1% of sales at the median across more than 1,000 organizations — and top performers achieve first-pass yield rates nearly 8 percentage points higher than bottom performers. Every percentage point of first-pass yield improvement translates directly into margin. Scrap and rework consume materials, machine time, and labor without producing saleable output, making early detection one of the highest-ROI investments a manufacturer can make.
Continental Automotive's component plant in Brandýs nad Labem is a concrete example: using end-to-end production data for failure simulation, the site achieved a 49% reduction in scrap cost — a result that demonstrates what in-process data visibility can produce at scale.
KPIs impacted: Scrap rate, rework rate, first-pass yield, cost of quality, on-time delivery
When this matters most: High-mix, low-volume environments where every job is different and errors cannot be absorbed by volume — and regulated industries (aerospace, medical, defense) where every defect carries compliance and traceability consequences.
Advantage 2: Unified Visibility Across Machines, Operators, and ERP Workflows
Machine monitoring alone is not enough. Efficiency gaps frequently live in the handoffs between machines, operators, and ERP systems — not within any single layer. Seeing only machine output misses half the picture.
When a centralized view consolidates what each machine is running, who is working on which job, and whether work order instructions are being followed, managers can assess the full production picture rather than three disconnected data silos. Harmoni's factory orchestration platform is built specifically to combine machine data, operator activity, and ERP workflows into one unified view — connecting people, machines, and systems at the intersection where most efficiency losses actually occur.
The job costing problem: Without knowing how long an operator actually spent on a job versus how long was planned, job costing becomes estimation rather than fact. Inaccurate job costing distorts pricing, scheduling, and capacity planning decisions downstream. RFID-based labor tracking at the workcenter level is what makes actual versus planned labor variance a measurable, actionable figure rather than a guess.
The scheduling problem: When machine availability and operator status are visible in real time, supervisors can reassign work dynamically rather than discovering idle machines or unbalanced workloads at the end of a shift. A McKinsey industrial-assembly case integrating real-time MES and IoT data reported 5-7% monthly cost savings by reducing overtime and optimizing sequencing — driven by visibility that did not previously exist.
KPIs impacted: Labor utilization, OEE, job costing accuracy, schedule adherence, operator throughput
When this matters most: Environments running multiple concurrent jobs across many machines and operators, where coordinating people and equipment without a shared data layer produces constant scheduling friction and costing errors.
Advantage 3: Eliminate Wasted Time and Improve Resource Utilization
Every shift contains hidden losses that rarely appear on an end-of-shift report: idle machine time, operators waiting for instructions, non-productive steps like setup sheet searches or manual paperwork, and unplanned downtime that goes unaddressed because no one has visibility into it until it's too late.
Real-time data addresses all of these simultaneously:
- Live dashboards surface underutilized machines so supervisors can redirect work before the idle period compounds
- Automated digital delivery of setup instructions, job documentation, and quality requirements at the workcenter means operators are not manually searching for job folders or waiting for supervisor confirmation before starting
- Early warning signals from machine monitoring — cycle time drift, performance anomalies — allow maintenance teams to intervene before failures occur
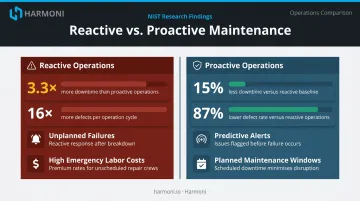
That last point is where the cost difference between reactive and proactive operations becomes most visible. NIST research found that predictive maintenance is associated with 15% less downtime and an 87% lower defect rate across U.S. manufacturing establishments.
The same study found that the most reactive quartile of manufacturers experienced 3.3x more downtime and 16x more defects than their proactive counterparts — a gap that reflects a fundamental difference in operating model, not just process tweaks.
Harmoni's platform digitizes work instructions and setup data delivery directly to the machine-side operator command center, replacing paper job folders and manual lookups with automated, job-specific information that appears at the right moment. When operators spend less time searching and waiting, they spend more time running parts — and that additional productive time accumulates across every shift and every workcenter.
KPIs impacted: OEE, machine utilization, MTBF, planned vs. unplanned maintenance ratio, throughput, labor efficiency
Best fit for: High-volume environments and facilities running multiple shifts, where non-productive tasks that seem minor at the individual level accumulate into measurable capacity losses across the operation.
What Happens When Real-Time Data Is Missing
Without live production visibility, manufacturing operations default to a specific and predictable set of failure modes:
- Inconsistent output quality — without process visibility, operator-to-operator and shift-to-shift variation goes undetected and uncorrected
- Late defect discovery — problems surface after full runs, at inspection, or worse, at the customer — compounding costs well beyond what early detection would have required
- Reactive supervision — supervisors respond to problems they could not see coming, turning root cause analysis into guesswork and making improvement initiatives hard to sustain
- Rising costs without clear causes — inaccurate job costing, uncaptured scrap, excessive rework, and unplanned downtime create cost structures that are nearly impossible to diagnose after the fact
- Scaling that works against you — as volume and complexity grow, managing more jobs, machines, and operators without a shared data layer means bottlenecks multiply faster than management can address them
Coastal Machine and Supply, a precision shop serving aerospace and defense, discovered this directly: when they first deployed machine monitoring, utilization was substantially lower than management expected. After adding real-time visibility and connecting machine data to ERP cycle-time information, they achieved a 46% relative increase in five-axis machine utilization — capacity that had always been there, invisible until the data made it actionable.
How to Get the Most Value from Real-Time Production Data
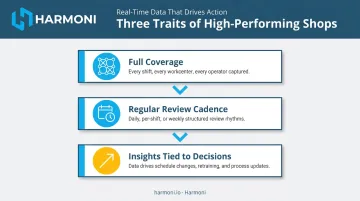
Collecting real-time data creates the conditions for improvement — but only if it's structured to drive decisions. Manufacturers who consistently see results from it share three operational traits:
Coverage across every shift and workcenter. Data captured only on select machines or by select operators creates gaps that limit what can be managed or improved. Partial visibility produces partial insights — and partial insights don't move the needle on efficiency.
A regular review cadence. Dashboards and alerts need to connect to a structured rhythm — daily, per shift, or weekly — where supervisors use the data to spot patterns, confirm improvements, and re-prioritize work. Harmoni's real-time dashboards surface shift-level and management-level information without manual data pulls or after-the-fact report building.
Insights tied directly to decisions. Whether that means adjusting a schedule, updating a process parameter, retraining an operator, or escalating a recurring issue to engineering — the data has to change what happens next. Manufacturers who use data to inform the next action improve. Those who only document it don't.
Conclusion
Real-time data gives manufacturers something that end-of-shift reports and manual tracking never can: the ability to act while there is still time to change the outcome. Faster detection, unified visibility, and eliminated non-productive waste don't deliver value in isolation — they compound.
The three advantages covered here — faster problem detection, unified visibility across machines and operators and ERP, and the elimination of non-productive waste — compound when applied consistently rather than deployed as one-off implementations. A single machine monitored on a single shift is a starting point. Every machine, every operator, every shift, integrated into a single view, is where the structural efficiency advantage builds.
Manufacturers who treat real-time visibility as a continuous operational discipline — reviewed regularly, acted upon consistently, and expanded as operations grow — accumulate a compounding advantage. The shops that see the most improvement aren't necessarily running newer equipment. They're running with better information, faster.
Frequently Asked Questions
How do you calculate real-time production efficiency?
Production efficiency is calculated as Actual Output ÷ Standard Output × 100. Real-time data systems make this calculation continuous and automatic, updating the figure throughout the shift rather than as a manual end-of-day exercise.
What is real-time production?
Real-time production is the continuous tracking of manufacturing output, machine status, and operator activity as events occur on the shop floor. It enables immediate visibility and response rather than relying on after-the-fact reporting from shift summaries or ERP snapshots.
What is real-time OEE?
Real-time OEE is a live measurement of Overall Equipment Effectiveness that tracks Availability, Performance, and Quality as they occur, not at shift end. This allows managers to identify and address OEE losses while there is still time within the shift to recover them.
What is an example of real-time production efficiency?
A CNC machine running below its expected cycle time is flagged automatically on a live dashboard. A supervisor is alerted, investigates mid-shift, and resolves the issue before the lost output accumulates. Without real-time visibility, the same situation would appear in a post-shift report with no opportunity for recovery.
How does real-time data help reduce scrap and production errors?
Real-time data enables in-process deviation detection. When machine output or operator execution drifts from the expected standard, alerts are triggered immediately — allowing correction before an entire batch is scrapped or a defect propagates through downstream operations.
What systems or tools are needed to capture real-time production data?
Real-time production data originates from machine controllers, sensors, and operator inputs. These sources feed into a centralized platform (such as a factory orchestration system, MES, or integrated dashboard) that consolidates the data into a single operational view for operators, supervisors, and managers.