Introduction
Most mid-to-large manufacturers aren't losing output because their machines can't keep up. They're losing it to friction—the gap between when a machine stops and when anyone notices, between when a job is assigned and when an operator actually starts, between what the ERP records and what's actually happening on the floor.
That friction is invisible until it compounds into missed deliveries, inflated labor costs, and scrap that shouldn't exist.
According to a NIST study on discrete manufacturing machinery maintenance, U.S. discrete manufacturers face an estimated $119.1 billion in preventable losses annually—$18.1 billion from downtime alone—across a 71-establishment model. The root causes aren't dramatic equipment failures. They're the small, repeated inefficiencies that accumulate across every shift.
This article covers four strategies manufacturers use to measurably improve production efficiency: gaining real-time shop floor visibility, eliminating wasted operator time, automating non-productive tasks, and tracking the right KPIs continuously.
Key Takeaways
- Production efficiency = Actual Output ÷ Standard Output; closing that gap is where margin improvement lives
- The biggest losses hide between systems: between machines, operators, and ERP records
- Real-time visibility is the prerequisite for every other improvement strategy
- Automating coordination tasks (not just machines) converts idle time into productive output
- Leading KPIs catch problems during a shift; lagging KPIs confirm what already happened
What Is Production Efficiency and Why Does It Matter?
Production efficiency measures how much output a facility generates relative to its maximum potential:
Production Efficiency (%) = Actual Output ÷ Standard Output × 100
"Standard output" should reflect ideal cycle times, equipment specifications, or verified industry benchmarks—not padded targets that hide underperformance.
For mid-to-large manufacturers, closing the gap between actual and standard output improves profit margins, on-time delivery rates, and ROI on capital equipment—without additional headcount or new machines. A facility running at 65% efficiency that reaches 80% gains roughly 23% more throughput from the same floor space, the same equipment, and the same operators.
That said, raw efficiency numbers can mislead. Narrowly optimizing output without watching quality and maintenance creates its own set of problems.
Don't Chase Efficiency in Isolation
Pushing output targets without the right process controls in place often backfires:
- Scrap rates climb when operators rush to hit output targets
- Equipment degrades faster when maintenance is deferred
- Operator burnout follows sustained pressure without process support
OEE (Overall Equipment Effectiveness)—which multiplies Availability × Performance × Quality—is a more complete companion metric. Vorne's foundational OEE framework establishes 85% as the world-class benchmark, tracing back to Seiichi Nakajima's 1984 work in Japanese automotive manufacturing. Many modern manufacturers operate closer to 60%—meaning a meaningful share of capacity is already paid for but going unused every shift.
What's Actually Causing Production Inefficiency?
Two factories with identical machines often produce vastly different output. The difference isn't the equipment—it's the invisible friction in the gaps between systems.
Where Efficiency Actually Disappears
The most common root causes aren't dramatic failures. They're mundane and persistent:
- Unplanned machine downtime — time between a machine stopping and a technician arriving
- Operator idle time — gaps between job completion and the next job starting
- Manual data entry errors — production records that don't reflect what actually happened
- Inconsistent work instructions — every operator running the same job slightly differently
- Poor job sequencing — machines waiting on upstream processes that weren't coordinated
- No real-time feedback — problems that compound for hours before anyone acts
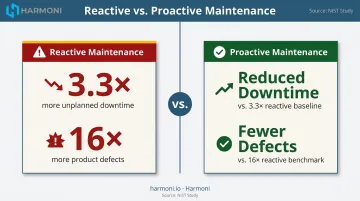
The NIST study noted that establishments relying heavily on reactive maintenance showed 3.3× more downtime and 16× more defects than those using advanced maintenance strategies. The gap between reactive and proactive operations isn't incremental—it separates low-performing shops from high-performing ones at a fundamental level.
The Real Problem: Lack of Data Granularity
Most manufacturers know production is lagging. What they lack is the data granularity to pinpoint exactly where and why. End-of-shift reports confirm a bad day happened. They don't tell you which 45-minute stretch cost the most, or why.
Fixing production inefficiency starts with seeing it clearly—and that requires real-time data, not after-the-fact summaries.
Strategy 1: Gain Real-Time Visibility Into Shop Floor Operations
You can't improve what you can't see. Yet 70% of manufacturers still collect production data manually, according to a Manufacturing Leadership Council survey—a method that reveals problems only after they've already cost production time.
End-of-shift reports tell you what went wrong. Real-time monitoring lets you catch it while you can still do something about it.
What Real-Time Visibility Actually Means
Real-time visibility isn't just having a dashboard. It means knowing—in the same moment it occurs:
- Which machines are running vs. idle, and why
- Which operators are active on which jobs
- How actual cycle times compare to standard times
- Where bottlenecks are forming before they cascade downstream
The Unified Data Challenge
The harder problem is that machine data, operator activity, and ERP transactions typically live in completely separate systems. A machine that stops appears as downtime in one system. The job it was running still shows as active in the ERP. The operator clocked onto that job for another 40 minutes before anyone noticed.
Effective visibility requires bringing those data streams together in one view—so managers see operational context, not just raw data points.
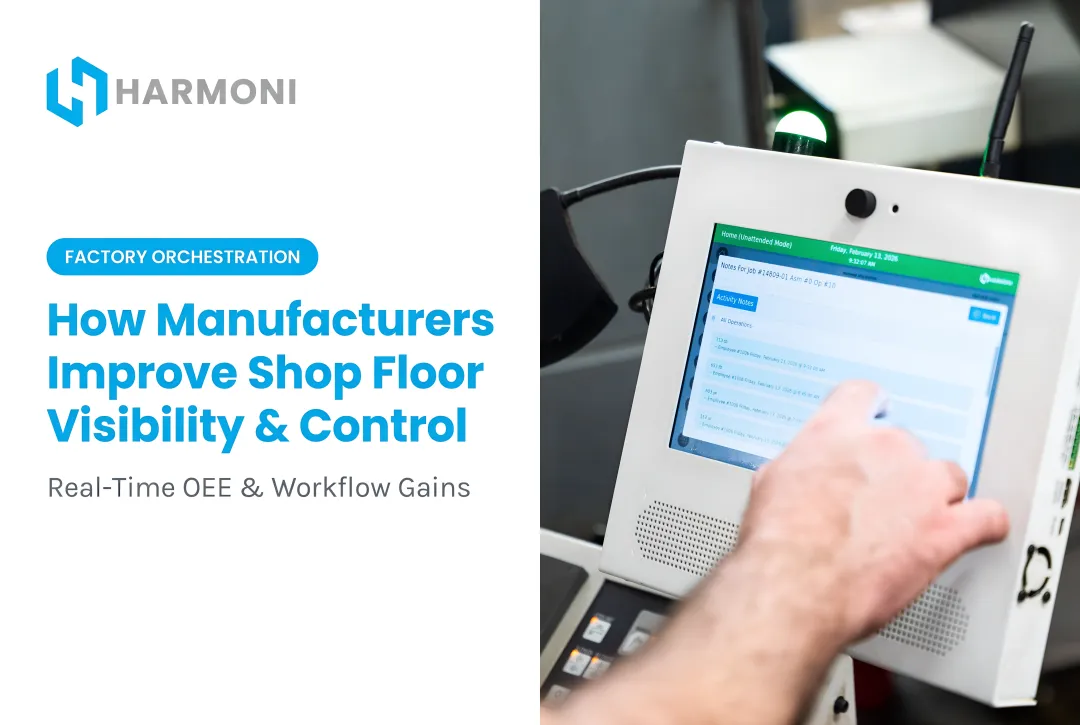
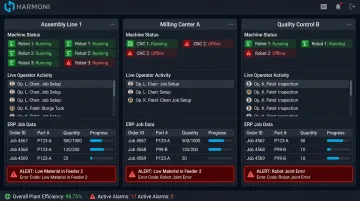
Harmoni's factory orchestration platform addresses this by sitting between ERP systems, MES systems, machines, and operators. It combines machine data, RFID-tracked operator activity, and ERP job data into a unified real-time dashboard.
Managers can see every machine's efficiency and progress simultaneously, receive exception alerts when performance deviates, and respond from their desk (including calling the work cell directly) without walking the floor.
Faster Response, Less Scrap, More Throughput
When problems surface in real time rather than hours later, the operational impact is measurable:
- Response times shrink because managers act on live data, not shift summaries
- Scrap that would accumulate across an entire shift gets caught in the first 15 minutes
- Throughput improves without adding resources—the capacity was already there, just invisible
Strategy 2: Eliminate Wasted Operator Time and Standardize Work Execution
Operator time is the most underestimated efficiency loss in manufacturing. A significant portion of any given shift gets consumed by activities that add zero value to the part:
- Searching for job instructions or paper travelers
- Manually logging ERP transactions
- Waiting for job assignments
- Tracking down tooling before a run can start
WessDel, a precision aerospace and defense manufacturer, found that each operator spent an average of 11 minutes completing every ERP transaction—and performed that multiple times per shift. Harmoni's RFID automation reduced that to seconds, recovering 17 productive hours per employee per month.
The Standardization Imperative
When every operator runs the same job differently, output quality and timing become unpredictable—not because of machine variance, but because of human variance. Standardizing work execution through digital work instructions and enforced step sequences eliminates that variability.
The benefits compound:
- Scrap rates drop when operators follow consistent, verified processes
- Job costing becomes accurate when actual labor time aligns with estimated labor time
- Training time shortens when new operators follow a documented, step-by-step process
Automating the Handoff Between Jobs
Idle time between jobs is a coordination failure—operators waiting for assignments, physically hunting for travelers, or manually checking in before starting work. Automating those handoffs directly recovers that time.
Harmoni's RFID-based workcenter command centers detect nearby employees and active jobs automatically. The correct work instructions, setup sheets, and CNC programs surface at the machine terminal the moment the operator arrives—no searching, no manual check-in, no paper traveler to locate.
Digital tracking also closes the accountability loop. Managers gain visibility into actual performance patterns—who is spending time where, and why—so coaching targets real bottlenecks instead of guesswork.
Strategy 3: Automate Non-Productive Tasks and Prevent Production Errors
There are two types of automation in manufacturing. The first—automating machines—requires significant capital investment. The second—automating the administrative and coordination tasks surrounding production—is achievable with software and delivers immediate ROI.
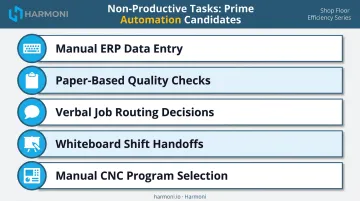
Non-productive tasks that are prime automation candidates:
- Manual ERP data entry and labor charging
- Paper-based quality checks and manual transcription
- Job routing decisions made verbally or by supervisor intervention
- Shift handoffs that rely on memory or whiteboard notes
- CNC program selection performed manually by operators
Preventing Errors Upstream, Not Catching Them Downstream
Digital workflows prevent production errors before they occur rather than detecting defects after the fact. When operators are guided through step-by-step instructions with built-in checkpoints—rather than relying on memory or outdated paper travelers—error rates and scrap rates fall.
Harmoni's digital quality checksheets are linked to specific parts, revisions, operations, and machines via RFID job detection. The correct checksheet surfaces automatically at the machine terminal, pre-loaded with inspection parameters, tolerances, and measurement tool recommendations. Real-time trend graphs surface when measurements are drifting toward out-of-tolerance conditions, giving operators the window to correct the process before scrap is produced.
Automated Machine Data Collection
Manual part count logging and cycle time entry introduce a specific problem: managers know the data was manually entered, so they discount it. Decisions get made on data everyone treats with skepticism.
When machine data is captured automatically—part counts logged directly from the CNC control, cycle times recorded in real time—the data becomes reliable enough to inform decisions. With trustworthy data, OEE stops being a reporting exercise and starts driving actual scheduling, quoting, and capacity planning.
Process Control at the Workcenter
Harmoni's automated CNC program loading takes process control a step further. When an operator's RFID tag is detected at a machine, the system identifies the active job from the ERP and presents the correct program for loading automatically. If changes are made at the machine, alerts go to the appropriate personnel and approval is required before a new revision becomes current — eliminating the risk of an outdated program reaching the spindle.
Strategy 4: Track the Right KPIs to Sustain and Scale Improvements
Improvement initiatives stall when KPI tracking is retrospective. Monthly reports confirm what went wrong. They don't help anyone prevent it next month.
Core Production Efficiency KPIs
| KPI | What It Measures |
|---|---|
| OEE | Availability × Performance × Quality — the most complete equipment effectiveness metric |
| Machine Utilization Rate | Percentage of planned production time a machine is actively running |
| Production Efficiency % | Actual output vs. standard (ideal) output |
| First Pass Yield (FPY) | Percentage of units completing a process without rework, retest, or scrap |
| Labor Efficiency Ratio | Actual labor output relative to expected output for hours worked |
Harmoni tracks OEE across all three components in real time—Availability, Performance, and Quality—by combining machine data from CNC controls (Mazak, Haas, Fanuc, Heidenhain, Siemens, DMG MORI, Makino, Fadal) with ERP transactional data and operator labor records.
Leading vs. Lagging Indicators
The leading vs. lagging distinction often matters more than which specific KPIs you select:
- Lagging indicators (monthly scrap rate, end-of-quarter OEE) confirm what already happened. They're essential for benchmarking and trend analysis.
- Leading indicators (real-time cycle time deviation, machine idle duration, in-shift quality trends) allow managers to intervene before efficiency loss compounds into missed delivery targets.
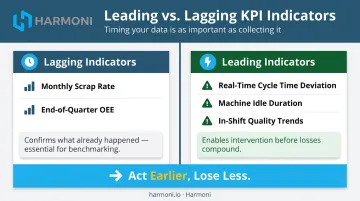
Both types are necessary. But without leading indicators, efficiency losses are already baked in before anyone reviews the weekly report.
Cadence and Review Matter
A strong KPI dashboard with no structured review process delivers reporting, not improvement. What actually moves numbers is a consistent daily or shift-level review cycle where:
- Production data from the previous shift is reviewed against targets
- Deviations are assigned to specific owners
- Corrective actions are tracked to closure
Shops that follow this cadence consistently stop re-discovering the same problems month over month — they close the loop before the next shift creates the same loss.
Frequently Asked Questions
How do you track production efficiency?
Production efficiency is tracked by comparing actual output against standard output in real time, using machine monitoring systems or factory orchestration platforms that automatically capture part counts, cycle times, and downtime data — eliminating manual data entry and producing numbers reliable enough to act on immediately.
What are the key KPIs for measuring production efficiency?
The core KPIs are OEE, machine utilization rate, production efficiency percentage, first pass yield, and labor efficiency ratio. The most useful versions of these metrics are tracked continuously during production—not compiled retroactively after a shift ends, when corrective action is no longer possible.
What is an example of production efficiency?
If a CNC machine's standard output is 100 parts per shift but it produces only 80 due to setup delays, idle time, or scrap, production efficiency is 80%. OEE's three-component structure (availability, performance, quality) identifies which loss category is responsible — pointing directly to the right corrective action.
What is the difference between production efficiency and productivity?
Production efficiency measures actual output relative to maximum potential output — how close an operation came to its theoretical ceiling. Productivity measures output relative to total inputs consumed, such as labor hours, materials, and energy. Both matter, but efficiency diagnoses utilization while productivity evaluates resource consumption.
What causes low production efficiency in manufacturing?
The most common causes are unplanned machine downtime, operator idle time between jobs, inconsistent execution of work instructions, poor job sequencing, and a lack of real-time data visibility—which allows problems to compound for hours before anyone is aware they exist.
How does reducing operator downtime improve production efficiency?
Operator idle time—waiting for job assignments, searching for instructions, completing manual administrative tasks—directly reduces the percentage of shift time spent on value-added work. Automating those coordination tasks converts idle minutes into productive output without changing staffing levels or adding headcount.