Introduction
An unplanned machine failure rarely stops at one machine. It triggers missed delivery commitments, scrapped parts, safety exposure, and emergency labor costs — all before the root cause is even identified.
For mid-to-large manufacturers running precision CNC equipment, the risk compounds quickly. Long lead times for spindle components mean every hour of degraded machine health is also an hour of quality exposure.
Deloitte estimates unplanned downtime costs industries $50 billion per year, with poor maintenance strategies reducing plant productive capacity by 5% to 20%. Meanwhile, NIST reports that manufacturing machinery maintenance costs can range from 15% to 70% of cost of goods produced — a range that separates proactive monitoring programs from reactive ones.
This article covers what machine condition monitoring and fault diagnostics are, the five core techniques used in manufacturing environments, and a practical step-by-step process — grounded in a CNC machining example that shows how the approach works on a real shop floor.
Key Takeaways
- Condition monitoring tracks equipment health continuously to detect anomalies early; fault diagnostics identifies what is wrong, where, and why.
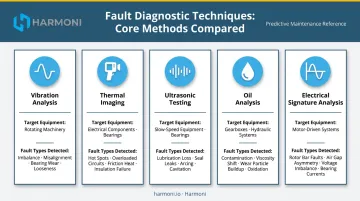
- Five core techniques make up the diagnostic toolkit: vibration analysis, thermal imaging, ultrasonic emission, oil analysis, and electrical signature analysis.
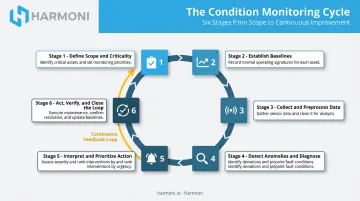
- Effective programs follow six structured stages — from defining scope and baselines through detection, diagnosis, action, and verification.
- Most monitoring programs lose value not from bad sensors — but from the lag between detecting a fault and getting a technician to act on it.
What Is Machine Condition Monitoring and Fault Diagnostics?
Machine condition monitoring is the continuous or periodic collection of sensor data from operating equipment to evaluate its current health state and detect deviations from normal behavior before failures occur. Think of it as a critical input into predictive and condition-based maintenance programs, not a substitute for them.
Fault diagnostics is what follows detection. Where monitoring tells you something is wrong, diagnostics tells you what, where, and why — enabling targeted corrective action rather than a blanket teardown based on guesswork.
Together, they apply across the most failure-critical assets in manufacturing:
- Rotating machinery: motors, spindles, pumps, conveyors
- CNC machine tools and machining centers
- Compressors, gearboxes, and hydraulic systems
- Any asset whose unexpected failure disrupts production or creates safety risk
One distinction matters here: condition monitoring assesses the current state of an asset, while prognostics estimates its remaining useful life. Together, they form a comprehensive reliability strategy — but condition monitoring is where most facilities should start.
Major Fault Diagnostics Techniques in Manufacturing
No single technique covers every failure mode. Different physical failure mechanisms produce different measurable signals, and technique selection should follow from the equipment type, its known failure modes, and its criticality. Here's how the five core techniques break down.
Vibration Analysis
Vibration analysis is the backbone technique for rotating equipment. Accelerometers measure vibration signatures and frequency spectra, producing data that reflects the mechanical state of the machine.
Because each failure mode — imbalance, misalignment, bearing wear, gear defects, looseness — generates a characteristic fault frequency in the vibration spectrum, a trained analyst (or algorithm) can identify not just that something is wrong, but which component is degrading.
ISO 13373-2 covers the commonly used techniques for vibration condition monitoring, analysis, and diagnostics of machines, making it the reference standard for rotating machinery vibration programs. One limitation: vibration analysis becomes less effective on low-speed equipment, where fault signatures are subtle and easily obscured.
Thermal / Infrared Imaging
Thermal imaging detects heat anomalies caused by friction, electrical resistance, lubrication failure, or overloading — conditions that produce temperature signatures before visible damage appears. It's particularly valuable for:
- Electrical panels and motor windings, where thermal anomalies precede mechanical failure
- Bearing housings, where localized heat buildup indicates lubrication breakdown or overloading
- Hydraulic components and drive systems running under abnormal loads
Infrared thermography is a non-contact technique, which means it can be applied during normal operation without interrupting production.
Acoustic Emission and Ultrasonic Testing
Acoustic emission and ultrasonic testing detect high-frequency stress waves generated by micro-cracks, friction, cavitation, and early-stage surface wear. These signals occur at frequencies well above what standard vibration accelerometers capture, making this technique a complementary addition to vibration analysis, not a replacement.
Its particular strengths include:
- Slow-speed equipment, where vibration-based fault signatures are too weak to be reliable
- Early bearing defect detection, catching problems before vibration analysis would register them
- Acoustic lubrication control, helping teams optimize re-lubrication intervals rather than following calendar-based schedules
Oil and Lubricant Analysis
Oil analysis examines lubrication samples for wear particles, contamination, viscosity changes, and chemical degradation. The diagnostic value is in the specifics: the type, size, and concentration of wear particles indicate which component is wearing and at what rate.
Key indicators from oil analysis:
- Large ferrous particles — suggest adhesive wear in gears or bearings
- Fine, evenly distributed particles — indicate normal wear within acceptable range
- Elevated silicon contamination — points to ingested dirt or degraded seals
- Viscosity out of spec — indicates oxidation, dilution, or incorrect lubricant used
This technique is especially effective for gearboxes, compressors, and hydraulic systems where oil sampling is practical.
Electrical Signature Analysis (ESA) / Motor Current Signature Analysis (MCSA)
ESA and MCSA analyze the electrical current waveform drawn by a motor to detect both mechanical and electrical faults — rotor bar cracks, bearing defects, air gap eccentricity, and winding faults — without requiring physical access to the machine.
EPRI lists ESA for online equipment condition monitoring, covering motor current signature analysis and motor health assessment. In CNC environments specifically, where spindle motor condition directly affects surface finish quality and dimensional accuracy, MCSA is particularly useful — monitoring spindle health without stopping the machine or interrupting the cut.
Why Condition Monitoring Is Critical for Manufacturers
The financial case is straightforward. The DOE FEMP reports that preventive maintenance delivers 12% to 18% cost savings over reactive maintenance. NIST data shows that among manufacturing facilities, only 17.3% of maintenance practices are predictive — while 45.7% remain reactive. That gap translates directly into unplanned downtime and emergency repair costs that preventive programs avoid.
Beyond cost, there's a safety dimension. Research by Bourassa, Gauthier, and Abdul-Nour found that 272 of 773 manufacturing accidental events were directly tied to equipment failure, with 13 resulting in direct human consequences. Condition monitoring isn't only an uptime tool — it's a reliability and safety input.
Operational benefits in practice:
- Catches developing faults before they cascade into secondary component damage
- Shifts maintenance from calendar-driven to condition-based, reducing unnecessary PM costs
- Provides lead time to schedule repairs during planned windows instead of emergency shutdowns
- Identifies equipment at risk of failure before a hazardous event occurs
- Enables accurate job costing by correlating machine health with actual production output
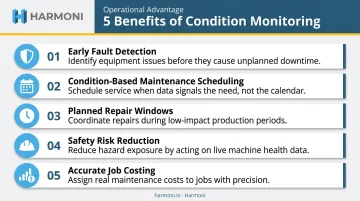
Each of those benefits compounds. A bearing fault caught early is a scheduled four-hour maintenance event. Caught late, after the bearing seizes and damages the spindle housing, it becomes a rebuild measured in days and thousands of dollars.
How Machine Condition Monitoring Works: Step by Step
Most condition monitoring programs fail not because of poor sensor selection but because they skip or rush specific stages — particularly baseline establishment and the feedback loop between diagnosis and corrective action.
Step 1 – Define Equipment Scope and Criticality
Start by identifying which assets to monitor and ranking them by criticality. Not every machine warrants continuous sensor coverage. Assess criticality across four factors:
- Production impact — what stops if this machine goes down?
- Repair cost and lead time — how long and how expensive to restore?
- Failure frequency — how often has this asset failed historically?
- Safety exposure — does failure create a hazard?
Start with the highest-criticality assets. The return on investment is fastest where the cost of failure is highest.
Step 2 – Establish Baselines and Select Techniques
Before anomalies can be detected, normal must be defined. Collect baseline data across representative operating states — different speeds, loads, and temperatures. A baseline taken only at light load will generate false alarms when the machine runs heavy production.
Technique selection follows from known failure modes:
- CNC spindles → vibration analysis + MCSA
- Hydraulic systems → thermal imaging + oil analysis
- Slow-speed conveyors → ultrasonic testing
- Motor drive systems → ESA/MCSA + thermal imaging
Step 3 – Collect and Preprocess Data
With baselines set, sensors log vibration, temperature, current, acoustic, or oil data continuously or at defined intervals. Data quality is the constraint most teams underestimate. Before analysis:
- Filter out noise and outliers from non-representative operating conditions
- Exclude idle-state readings from trend calculations
- For variable-speed equipment, ensure sampling logic captures data during actual production rather than ramp-up or coast-down
Step 4 – Detect Anomalies and Apply Diagnostics
Anomaly detection flags when a condition indicator deviates from baseline. That's the detection step. What follows — diagnostics — shifts the question from "something changed" to "here is the specific fault, component, and severity."
This is where most programs stall. Threshold alerts fire but lack the diagnostic specificity to guide confident action. Teams run manual verifications, inspections consume time, and the monitoring system earns a reputation for crying wolf. Programs that invest in diagnostic specificity change maintenance outcomes; programs that don't just generate noise.
Step 5 – Interpret Results and Prioritize Action
Not every anomaly requires the same urgency. Triage findings by combining severity with asset criticality:
- High severity + high criticality → act within hours, notify production planning immediately
- Low severity + high criticality → schedule for next planned window, monitor closely
- Any severity + low criticality → document, trend, schedule at normal interval
Communicate findings to operators and maintenance teams in plain language — specific component, nature of the fault, recommended action, and timeline. Raw data stays in the system; actionable information reaches the people.
Step 6 – Act, Verify, and Close the Loop
Execute the corrective maintenance. Then verify: confirm through post-repair sensor data that the fault signature has cleared and readings have returned to baseline. Feed the outcome back into the monitoring system to refine baselines and detection thresholds.
This cycle — detection, diagnosis, action, verification, refined model — is what builds reliability over time rather than just accumulating data. Platforms like Harmoni's factory orchestration system, which bring together real-time machine data alongside operator workflows and ERP context, help close this loop by connecting condition insights to the people who need to act on them.
Condition Monitoring in Action: A CNC Machining Example
A mid-sized precision machining shop notices inconsistent surface finish quality on a horizontal machining center. Research by Raju et al. (2024) links spindle bearing vibration to surface roughness in CNC milling, identifying the spindle bearing as a primary vibration source — consistent with what the maintenance team begins to investigate.
The diagnostic sequence:
- Vibration analysis of the spindle shows elevated amplitude at a frequency consistent with outer race bearing wear.
- Thermal imaging of the spindle housing confirms a localized temperature rise at the bearing location — not a diffuse overheat, but a point-specific signature.
- Production history review reveals that the anomaly began shortly after a tooling change that required higher-than-normal spindle loads.
Diagnosis: Bearing wear accelerated by an overload event — not end-of-life degradation on a normal wear curve. That distinction changes both the repair approach and the root cause correction.
The outcome: The team schedules a bearing replacement during a planned weekend window without pulling the machine from production. The repair takes four hours. A reactive failure left to seizure would have meant spindle housing inspection, potential rebuild, and multiple days of unplanned downtime.
Three lessons from this example:
- Clean spindle vibration baselines at multiple load conditions made the deviation detectable in the first place — without that reference data, the anomaly goes unnoticed longer.
- Vibration flagged the problem; thermal imaging confirmed the location. Cross-technique agreement is what turns a suspicion into a scheduled repair.
- Correlating the fault to the tooling change converted a bearing swap into an actual root cause fix — the shop revised its loading protocol to prevent recurrence.
How Harmoni Helps Bridge the Gap Between Machine Data and Action
Detecting a fault is only half the problem. Even when sensors identify an anomaly and diagnostics point to the component, that information often stays locked in a monitoring dashboard — disconnected from the operators running the machines, the ERP scheduling production, and the maintenance workflows that should respond.
That gap is where manufacturing facilities lose the value of their monitoring investment.
Harmoni's factory orchestration platform operates as the operational layer that connects machine condition data to the people and systems that act on it. The platform combines:
- Real-time machine data — cycle time, OEE status, and performance deviations surfaced to managers from any device
- RFID-enabled operator detection — automatically identifies who is at each machine and what job is running, so when a condition alert surfaces, the right operator is already identified
- ERP workflow integration — ties machine performance to job-level cost and schedule data, making it possible to assess the production impact of a condition alert in context, not in isolation
- Workcenter command centers — machine-side terminals that give operators the visibility and communication tools to respond without leaving the floor
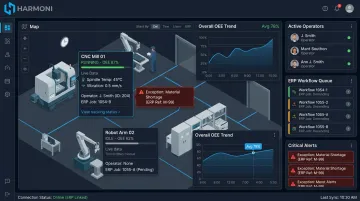
When a performance anomaly appears, managers receive exception alerts and can reach the operator directly. The operator at the machine has a clear view of current status and can initiate a maintenance call without leaving the workcenter.
For precision manufacturers in aerospace, defense, and automotive production, Harmoni integrates with the CNC controls and ERP systems already in use. Compatible controls include Haas, Fanuc, Mazak, DMG MORI, Siemens, and Heidenhain; supported ERP platforms include Epicor, Infor, and JobBoss2. No rip-and-replace of existing infrastructure is required.
Frequently Asked Questions
What is machine condition monitoring?
Condition monitoring is the continuous or periodic collection and analysis of sensor data from operating equipment to evaluate health state and detect anomalies early. It supports predictive and condition-based maintenance by providing objective equipment data rather than relying on time-based schedules or reactive failure reports.
How are machine faults diagnosed?
Fault diagnostics moves beyond detection by analyzing sensor outputs (vibration spectra, thermal patterns, current signatures, oil samples) to identify the specific component affected and the fault's severity. This enables targeted corrective action rather than a trial-and-error teardown.
What are the 6 processing blocks in condition monitoring per ISO 13374-2?
Per NISTIR 8012, ISO 13374-2 defines six blocks: Data Acquisition, Data Manipulation, State Detection, Health Assessment, Prognostic Assessment, and Advisory Generation. The loop closes when repair outcomes feed back into the system to refine future detection.
What is the difference between fault detection and fault diagnostics?
Fault detection identifies that something has deviated from normal — an anomaly exists. Fault diagnostics determines what is wrong, which component is affected, and why — giving maintenance teams the specificity needed to plan a targeted repair rather than a trial-and-error inspection.
What condition monitoring techniques work best for CNC machines?
Vibration analysis is the primary technique for CNC spindles and axis drives, detecting imbalance, bearing wear, and misalignment. MCSA complements it by monitoring spindle motor health non-invasively, and thermal imaging confirms heat-generating faults in spindle housings and electrical components.
How does condition monitoring reduce unplanned downtime?
By detecting developing faults before failure, condition monitoring gives maintenance teams lead time to schedule repairs during planned production windows. This converts emergency breakdowns into managed maintenance events, reducing repair costs and protecting delivery commitments.