This guide covers the root causes behind that gap and the strategies that actually close it — spanning process improvement, workforce development, technology adoption, and the metrics that tell you whether progress is real.
Key Takeaways
- Productivity stalls when root causes go unaddressed: equipment downtime, workflow waste, and disconnected data systems
- Standardized processes, cross-trained operators, and preventive maintenance are what sustained output improvements are built on
- Real-time visibility closes the gap between when problems occur and when managers can act on them
- Track five KPIs consistently: OEE, throughput, cycle time, scrap rate, and labor productivity
- Technology accelerates good processes — it doesn't fix broken ones
What Is Manufacturing Productivity?
Manufacturing productivity is the ratio of output to input — how much a facility produces given a fixed amount of labor, time, materials, and capital. It's often confused with efficiency, but the two measure different things. Efficiency describes how well resources are used; productivity describes how much gets made. The two are closely linked: more efficient processes enable higher output.
How Manufacturers Actually Measure It
The basic formula is straightforward: Total Output ÷ Total Input. In practice, most discrete manufacturers track productivity through a handful of operational metrics:
- OEE (Overall Equipment Effectiveness) — the primary composite metric, covered in detail later
- Throughput — units produced per time period
- Cycle time — time to complete one production cycle
- Scrap rate — percentage of material wasted
- Labor productivity — output per labor hour
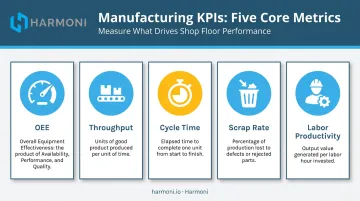
These metrics turn an abstract ratio into actionable data — the kind a supervisor can use mid-shift to redirect resources, adjust pacing, or catch a scrap problem before it compounds. Understanding what they measure is the starting point for knowing where to improve them.
Why Manufacturing Productivity Stalls: Common Root Causes
Before applying strategies, teams need to understand what's actually driving losses — because the causes are often different from what managers assume. Most productivity losses trace back to four interconnected problem areas.
Workflow and Process Waste
Unoptimized layouts, redundant steps, and non-standardized procedures force workers into activities that add no value. Common examples include:
- Searching for tools or materials between operations
- Waiting on approvals before proceeding
- Re-doing work due to unclear or inconsistent instructions
These aren't isolated incidents — they compound across every operator, every shift.
The People-and-Information Gap
Operators frequently lack real-time access to job instructions, setup requirements, or quality specifications when they need them. The result: errors, scrap, and time lost to manual verification. When an operator has to walk across the facility to confirm a spec or locate the current drawing revision, that's a direct productivity loss — one that repeats every shift.
Equipment Downtime and the Reactive Maintenance Trap
According to NIST's 2024 analysis of U.S. discrete manufacturing, downtime accounts for an estimated $245 billion in losses — roughly 8.3% of planned production time across discrete manufacturing sectors. When machines are maintained reactively, unplanned stoppages compound rapidly and the true cost includes not just repair time but cascading schedule disruptions.
Disconnected Systems and Visibility Blind Spots
When ERP data, machine data, and operator activity exist in separate silos, managers can only identify problems after production runs are complete. That delay makes course-correction slow and turns continuous improvement into a reactive exercise. By the time the data surfaces, the opportunity to intervene has already passed.
Effective Strategies to Improve Manufacturing Productivity
Four strategies consistently deliver the largest productivity gains in discrete manufacturing: standardizing processes, developing the workforce, maintaining equipment proactively, and automating the non-productive steps that drain operator time.
Standardize Processes and Eliminate Workflow Waste
Standardized work — documented "one best way" procedures — is the foundation of consistent output. Without SOPs and standard workflows, individual workers improvise, creating variation in quality, cycle time, and error rates. This variation is invisible until it shows up as scrap or a missed delivery.
Lean manufacturing provides the practical tools to close this gap:
- 5S — sort, set in order, shine, standardize, sustain — establishes a clean, organized baseline
- Value stream mapping — identifies where time is consumed without adding value
- Standard work — locks in the most efficient sequence so it can be repeated and improved
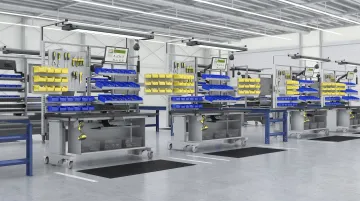
Optimizing facility layout matters too. Placing work areas, tools, and materials in logical proximity reduces unnecessary operator movement. Even a two-minute reduction in travel time per operator per shift adds up to meaningful gains at scale — and it costs nothing beyond the planning effort.
NIST documented one component manufacturer, Island Components Group, that implemented Toyota Production System principles including standard work and one-piece flow. Daily output increased from 75 to 120 units, while work-in-progress inventory fell from 717 to 156 pieces.
Develop and Empower Your Workforce
A cross-trained workforce is a more flexible and productive one. Employees who understand their role in the broader production flow, can operate multiple stations, and have the authority to flag problems early are critical to maintaining output — particularly in high-mix environments where setups change frequently.
The productivity case for training is well-supported. McKinsey documented a 15% throughput increase at an aerospace and defense supplier after targeted cross-training eliminated a labor bottleneck where only one operator was qualified for a critical operation.
Workforce engagement compounds the effect:
- Employees involved in process improvement efforts flag problems earlier
- Recognition for incremental gains reinforces the behaviors that drive output
- Lower turnover preserves the institutional knowledge that experienced operators carry
Harmoni's platform supports this by delivering digital work instructions directly to operators at each workcenter, ensuring every employee — regardless of experience level — works from current, approved process documentation. In practice, that means fewer errors from outdated drawings and faster onboarding when new operators step into a station.
Implement Preventive Maintenance (TPM)
Total Productive Maintenance (TPM) shifts maintenance from reactive to preventive. The framework targets six major equipment losses that erode OEE: failures, setup and adjustment time, minor stoppages, reduced operating speeds, scrap, and rework.
The ROI case is direct: a scheduled two-hour maintenance window is a known, manageable cost. An unplanned breakdown at a bottleneck machine ripples through every downstream operation — and the cost compounds fast.
Key elements of an effective TPM program:
- Establish a maintenance schedule based on equipment age, usage cycles, and manufacturer recommendations
- Assign ownership at the operator level through autonomous maintenance — operators perform basic cleaning, inspection, and minor upkeep as part of their standard work
- Track downtime by cause so the highest-frequency failure modes get addressed first
Automate Non-Productive Tasks and Manual Steps
Automation in manufacturing doesn't just mean robots. It includes automating the administrative steps operators perform between production cycles: job routing, data entry, work order updates, inspection logging, and CNC program loading. When operators spend time on these tasks, throughput suffers even when machines are technically running.
Identifying automation candidates requires mapping current operator workflows and quantifying time lost per task per shift. A time study at WessDel — a precision aerospace and defense machine shop — found that operators were spending an average of 11 minutes per ERP transaction because they had to walk to shared terminals to clock in, change jobs, and log labor. Multiplied across multiple daily transactions, that added up to hours of lost production time per operator, per week.
After deploying Harmoni's RFID-enabled platform, those transactions dropped to seconds at the machine — recovering 17 productive hours per employee per month and producing a 5x return on ongoing platform costs. Harmoni automates several of the most time-consuming non-productive steps, including:
- Machine-side ERP transactions via RFID — eliminating shared terminal walks
- Automated CNC program loading — removing manual program selection between jobs
- Digital quality checksheets — replacing paper-based inspection logging
- Digital work instruction delivery — eliminating time spent searching for current drawings or specs
How Technology and Real-Time Visibility Accelerate Productivity
Strategy and intent drive results only when managers and operators can see what's happening on the shop floor as it happens — not hours later. Real-time visibility is what turns a reactive operation into a responsive one.
Real-Time Dashboards and Machine Monitoring
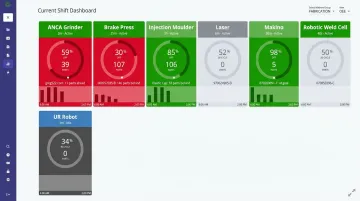
Modern machine monitoring tools give supervisors the ability to identify bottlenecks, equipment slowdowns, or operator delays as they occur. That means corrective action happens during the shift, not in a post-production debrief.
Those gains can be measured. Coastal Machine and Supply installed machine monitoring on a DMG MORI five-axis machine and reported a 46% utilization increase between the start of 2026 and mid-March, according to the shop's general manager. The machine didn't change — the team's ability to respond to real data did.
Factory Orchestration: Connecting the Layers
Real-time dashboards show what's happening. Factory orchestration platforms determine what should happen next — and coordinate the execution.
A factory orchestration platform sits between ERP systems, machines, and shop floor operators to coordinate job execution in real time. Core capabilities include:
- Automating job routing based on live shop floor conditions
- Delivering work instructions to operators at the right moment
- Combining machine data with ERP workflows into a unified view at each workcenter
Harmoni's factory orchestration platform takes this a step further using long-range RFID technology to automatically detect nearby employees and active jobs — eliminating manual check-ins and reducing wasted operator time between tasks. Rather than operators navigating multiple systems for job status, program access, and quality documentation, everything displays at the machine. Supervisors get a live view of production across the shop floor; operators get a command center at each workcenter.
Predictive Analytics and IIoT-Connected Equipment
Real-time visibility covers what's happening now — predictive analytics extend that window into what's likely to happen next. IIoT-connected machines can detect maintenance signals before a failure occurs, flagging abnormal vibration, cycle time drift, or temperature variation that precedes a breakdown. When equipment communicates early warning signs, teams can schedule maintenance before it becomes an emergency.
Over time, this shifts the maintenance posture from calendar-based prevention to condition-based prediction — a more efficient use of both maintenance resources and planned downtime windows.
Key Metrics to Track Manufacturing Productivity Improvements
Improvement initiatives need measurement to be credible. These five KPIs give manufacturers a complete picture of how well resources are being used.
OEE: The Primary Composite Metric
Overall Equipment Effectiveness combines three factors: Availability × Performance × Quality. The result is a single score reflecting how much of planned production time is genuinely productive.
Seiichi Nakajima, who developed the TPM framework, set 85% as the world-class OEE benchmark. Most facilities have meaningful room to improve before reaching that mark.
Four Supporting KPIs
| KPI | What It Measures | What Movement Signals |
|---|---|---|
| Throughput | Units produced per time period | Rising throughput = higher output capacity; falling throughput = bottleneck or downtime |
| Cycle time | Time to complete one production cycle | Shorter cycle time = process efficiency gains; longer = waste or equipment issues |
| Scrap rate | Percentage of materials wasted | Rising scrap = quality or process control problems; falling = better first-pass yield |
| Labor productivity | Output per labor hour | Improvement signals better workflow or training; decline may indicate turnover or process regression |
Establish baseline measurements before launching any improvement initiative, then track consistently over time. Short-term fluctuations are normal — trends over weeks and months are what drive decisions.
Real-time dashboards connected to live production data are essential for this. Weekly spreadsheet updates show you what already happened; they won't help you respond while it still matters.
Building a Culture of Continuous Improvement
Strategies and tools only sustain results when they're embedded in a culture that actively seeks small, daily improvements. The Lean concept of Kaizen (where every team member, from operators to managers, is encouraged to identify one problem and propose or implement one fix per shift or week) creates a compounding improvement effect that no single initiative can replicate.
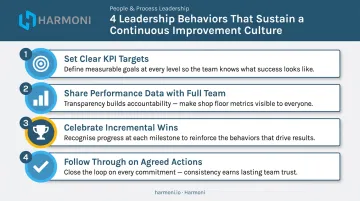
Leadership behaviors determine whether a CI culture takes root or stalls:
- Set clear KPI targets so teams can see what they're working toward
- Share performance data with the full team, not just management
- Celebrate incremental wins, not just quarterly results
- Follow through on agreed actions — unresolved issues are the fastest way to kill a CI culture
The failure mode is deploying improvement initiatives without follow-through. When teams raise problems and see no response, they stop raising problems. The initiative loses momentum, and old habits return within weeks.
Harmoni's Visual Factory module supports this by making real-time production data visible across the shop floor. Supervisors and operators share the same live view of performance — so accountability isn't a conversation that happens after the shift, it happens during it.
Frequently Asked Questions
What are the 5 M's of manufacturing?
The 5 M's — Man, Machine, Material, Method, and Measurement — are a root cause analysis framework used to identify the source of quality or productivity problems. A sixth M, Milieu (environment), is sometimes added. They're commonly used alongside fishbone (Ishikawa) diagrams when teams are tracing defects or inefficiencies back to their origin.
What is a common method for improving productivity in a manufacturing process?
Lean manufacturing is the most widely adopted approach. It focuses on identifying and eliminating waste — non-value-adding activities — through tools like 5S, value stream mapping, and standard work. The result is higher throughput, more consistent quality, and shorter lead times.
How do you measure manufacturing productivity?
The core formula is Total Output ÷ Total Input. In practice, that's tracked through KPIs such as:
- OEE (Overall Equipment Effectiveness)
- Throughput and cycle time
- Scrap rate and first-pass yield
- Labor productivity
Each metric captures a different dimension of resource utilization, and together they give a complete operational picture.
What causes low productivity in manufacturing?
Root causes vary by facility, but the most common include:
- Unplanned equipment downtime
- Unoptimized or unstandardized workflows
- Operators spending time on non-productive tasks
- Disconnected data systems that delay problem identification
- A workforce that is undertrained or disengaged from improvement efforts
How does real-time visibility improve manufacturing productivity?
Real-time visibility allows supervisors and operators to identify bottlenecks, equipment issues, or process deviations as they occur, enabling immediate corrective action rather than post-production analysis. This prevents losses from compounding across an entire shift before anyone notices.
What is OEE and why does it matter?
OEE (Overall Equipment Effectiveness) measures the percentage of planned production time that is truly productive by accounting for availability, performance, and quality. It's the industry standard benchmark for understanding how much productivity potential a facility is actually realizing, and which specific loss categories are dragging performance down.