Introduction
A CNC shop runs at 82% OEE, a number most plant managers would frame proudly. But measure that same operation against total calendar time, and the picture changes fast. Two-thirds of the week might be sitting idle: no operators, no jobs running, machines cold.
That's the gap Total Effective Equipment Performance (TEEP) exposes. Many manufacturers track OEE closely but have almost no visibility into schedule losses — unused shifts, idle weekends, capacity that never even makes it onto the production schedule.
This guide breaks down what TEEP means, how to calculate it, how it differs from OEE, and why real-time data matters for getting the number right.
Key Takeaways
- TEEP = OEE × Utilization, measuring true productive capacity across all available time
- TEEP reveals the "hidden factory": capacity lost to unscheduled downtime, not just production inefficiency
- The metric guides capacity planning and buy-vs-utilize decisions when evaluating growth
- Accurate TEEP depends on real-time data from machines, operators, and ERP/MES systems
What Is TEEP?
TEEP measures an operation's true capacity by combining two categories of loss: Equipment Losses, which OEE captures, and Schedule Losses, which Utilization captures. Together, they answer a question OEE alone can't: how much of your total possible production time is actually turning into good parts?
This is where the term "hidden factory" comes from. It's the capacity sitting inside a plant's walls right now: unused shifts, idle machines on weekends, gaps between jobs. All of it could theoretically be unlocked without buying a single new machine.
The critical distinction: time base
OEE measures performance against Planned Production Time, the hours you've actually scheduled for production. TEEP measures against All Time: 24 hours a day, 365 days a year, whether the plant is scheduled to run or not.
That difference matters. A shop running two shifts, five days a week, is only scheduling about 48% of the calendar week to begin with. TEEP accounts for that entire remaining chunk of time as available (and potentially reclaimable) capacity.
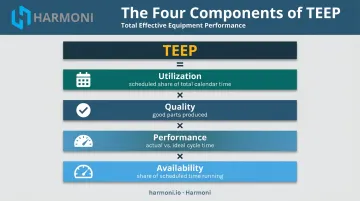
TEEP combines four underlying factors:
- Availability: the share of scheduled time the equipment actually runs
- Performance: how fast it runs compared to ideal cycle time
- Quality: the percentage of good parts produced
- Utilization: the share of total calendar time that's even scheduled for production
TEEP isn't a fringe metric either. The Society for Maintenance & Reliability Professionals' Best Practices Metrics Workshop lists Total Effective Equipment Performance as a recognized Operating Effectiveness metric under its Manufacturing Process Reliability pillar.
TEEP vs. OEE: Understanding the Difference
Both metrics multiply Availability, Performance, and Quality. The difference comes down to the denominator — and that changes what each number can actually tell you.
What OEE Measures
OEE (%) = Availability × Performance × Quality, calculated as a percentage of Planned Production Time only.
OEE tells you how well a machine or line performed during the hours it was actually scheduled to run. It ignores nights, weekends, or shifts that were never staffed in the first place: those simply aren't part of the equation.
What TEEP Measures
TEEP (%) = OEE × Utilization, where Utilization = Planned Production Time / All Time, expressed as a percentage of all 8,760 hours in a year.
TEEP tells you how much total capacity exists if you ran continuously, and how much of it you're actually capturing. A machine can post a strong OEE score and still have a weak TEEP score, simply because it's only scheduled a fraction of the time.
| Metric | Time Base | Formula | Primary Use Case |
|---|---|---|---|
| OEE | Planned Production Time | Availability × Performance × Quality | Shift-level process improvement |
| TEEP | All Time (24/7/365) | OEE × Utilization | Capacity planning, benchmarking, growth decisions |
The short answer: OEE measures how efficiently you run during scheduled hours. TEEP measures how much of your total possible capacity you're actually using, scheduled or not.
How to Calculate TEEP
TEEP is built from four component calculations, each pulling from a different part of the shop floor.
| Component | Formula | What It Captures |
|---|---|---|
| Availability | Run Time / Planned Production Time | Downtime during scheduled runs |
| Performance | (Ideal Cycle Time × Total Count) / Run Time | Slow cycles, minor stops |
| Quality | Good Count / Total Count | First-pass yield |
| Utilization | Planned Production Time / All Time | Scheduled share of calendar time |
The complete formula: TEEP = Availability × Performance × Quality × Utilization
A worked example
Consider a shop running two shifts, five days a week: 8 hours × 2 shifts × 5 days = 80 hours per week of planned production.
- Calculate All Time: 24 hours × 7 days = 168 hours per week
- Calculate Utilization: 80 / 168 = 47.6%
- Calculate OEE for that scheduled time using Availability × Performance × Quality, which comes to 65% in this example
- Calculate TEEP: 65% × 47.6% = 30.95%
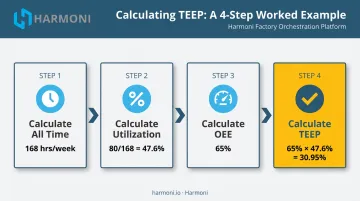
That number can look alarming next to a solid OEE score. It reflects how much of the calendar week the shop leaves on the table by design. That gap represents capacity scheduling changes alone could recover, before any investment in new equipment.
Where the data comes from
TEEP inputs typically pull from four sources:
- Machine sensors and PLCs: run time, cycle counts, and stop events
- MES systems: job-level tracking and shift assignments
- ERP job data: planned production schedules and order volumes
- Operator time logs: labor attribution and downtime reason codes
Manual or spreadsheet-based tracking is where this typically breaks down. A missed stopwatch entry, a mistyped count, or a forgotten shift note can skew Availability or Utilization, and once that happens, the resulting TEEP score is no longer trustworthy for capacity decisions.
Platforms like Harmoni that pull data directly from machine sensors and PLCs remove that manual-entry risk, keeping Availability and Utilization figures accurate without extra operator effort.
Why TEEP Matters for Manufacturers
TEEP's real value shows up before you sign a purchase order for new equipment. It answers a question that OEE can't: is the capacity you need already sitting unused inside your current shop?
Reclaiming that hidden capacity through better scheduling is almost always faster and cheaper than buying a machine. It also carries no financing risk, no installation downtime, and no ramp-up curve.
TEEP is most useful for:
- Capacity planning: deciding whether existing assets can absorb new orders
- Sales and order forecasting: knowing your realistic ceiling before quoting lead times
- Equipment investment decisions: separating "we're out of capacity" from "we're not scheduling what we have"
Once you've identified where TEEP applies, setting a realistic target matters just as much. OEE.com's benchmark cites 85% as the commonly referenced OEE figure for discrete manufacturing, while most manufacturers actually sit closer to 60%.
TEEP has no equivalent universal benchmark. Even a top-performing plant running around the clock typically achieves only 80-90% utilization of its total available time. Treat that gap as the realistic ceiling, not the floor.
Common Challenges in Measuring TEEP — and How Real-Time Visibility Solves Them
Getting an accurate TEEP score is harder than the formula suggests. Most shops run into the same three obstacles.
The obstacles:
- Manual data entry: stop times, counts, and reason codes logged by hand, often hours after the fact
- Disconnected systems: machine data, ERP schedules, and operator activity living in three separate places that never sync
- Delayed visibility: schedule and performance losses discovered in a weekly report instead of during the shift when something could still be done about it
The result is a TEEP calculation built on stale, incomplete inputs. By the time the number reaches a supervisor's desk, the capacity it describes is already gone.
This is the gap Harmoni's factory orchestration platform is built to close. Rather than pulling data from disconnected spreadsheets after the fact, Harmoni unifies machine data, operator activity, and ERP workflows in real time.
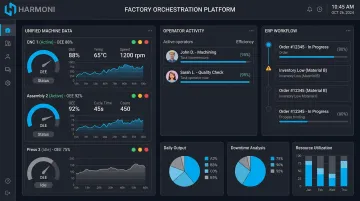
Manufacturers gain visibility into utilization and performance losses as they happen, not after production is already lost.
That matters most in environments where the data problem is compounded by complexity:
- CNC machining shops running multiple controls, such as Mazak, Haas, Fanuc, and Siemens, each with its own data format
- Aerospace and defense manufacturers managing ITAR/CMMC compliance alongside real-time floor visibility
- Precision job shops juggling high-mix, low-volume work where every ERP transaction needs to tie back to the right job and machine
In shops like these, manual TEEP tracking isn't just slow. It's frequently wrong. See how Harmoni's platform handles real-time visibility firsthand with a demo.
Frequently Asked Questions
What is a good OEE score?
World-class OEE is commonly cited around 85%, though most manufacturers fall closer to 60%. What counts as "good" varies widely by industry and equipment type, so use it as a directional target rather than a strict pass/fail line.
What is the OEE formula for performance?
Performance (%) = (Ideal Cycle Time × Total Count) / Run Time. It measures how close your actual production speed came to the ideal, capturing slow cycles and minor stops that Availability alone misses.
What is the difference between TEEP and OEE?
OEE measures productivity against Planned Production Time only. TEEP measures productivity against all available time (24 hours a day, 365 days a year) by factoring in Utilization on top of OEE.
What is a good TEEP score?
TEEP scores are naturally much lower than OEE scores since they account for every hour in the calendar year, not just scheduled ones. Even top-performing plants running continuously rarely exceed 80-90% Utilization of their total time capacity.
How often should TEEP be measured?
Continuous or shift-by-shift tracking gives far more accurate results than periodic manual snapshots. Real-time data collection catches schedule and performance losses as they happen, rather than reconstructing them from memory days later.
Can TEEP be improved without buying new equipment?
Yes. Improving scheduling, cutting changeover time, and gaining real-time visibility into losses can unlock significant existing capacity. Many manufacturers reclaim more capacity through better utilization of current assets than through capital investment alone.