That gap creates a real problem. Without the right KPIs in place, issues like scrap, unplanned downtime, and missed delivery dates tend to surface after the job is already done, not while there's still time to fix them.
This article breaks down what a manufacturing KPI actually is, the core categories they fall into, the specific metrics worth tracking, and how real-time visibility platforms are changing the way plants act on this information.
Key Takeaways
- KPIs differ from metrics — a KPI is tied to a specific business goal, not just a raw number
- OEE, downtime, cycle time, first pass yield, on-time delivery, and scrap rate form the core KPI set to track
- Reactive, end-of-shift reporting misses problems that real-time tracking catches instantly
- Accurate job costing depends on capturing true labor and machine data, not estimates
- Fewer, well-chosen KPIs beat a dashboard full of numbers nobody acts on
What Is a Manufacturing KPI?
A manufacturing KPI is a quantifiable, goal-linked measure used to evaluate production, quality, or operational performance against a specific business objective. Each KPI tells you whether you're winning or losing against that target in real time.
Here's the distinction that trips a lot of people up: a metric is simply a raw data point, like "units produced" or "machine hours." A KPI takes that data point and connects it to a goal.
For example, units produced per hour is a metric. Measured against a 150-unit/hour target, that same number becomes a KPI, strategically useful only once it's tied to a goal you're trying to hit.
APQC, a research and benchmarking organization, defines a metric as the numeric value of a measure, while a KPI is a strategically important type of measure tied to critical success factors and business goals.
Three traits separate a good KPI from a vanity metric:
- It aligns directly with a company or department goal
- It's specific and measurable, not vague or subjective
- It provides actionable insight, meaning it points to a clear next step when it moves in the wrong direction
If a number doesn't meet all three criteria, it's probably a metric worth watching, not a KPI worth reporting to leadership.
Why Manufacturing KPIs Matter for Operational Performance
Tracking the right KPIs helps manufacturers spot bottlenecks, cut waste, and make decisions based on actual data instead of gut feel. The financial stakes make this urgent.
Siemens' 2024 downtime study, based on interviews with 181 industrial professionals conducted between 2019 and 2023, quantifies just how much:
- An idle automotive production line now costs $2.3 million per hour, a 113% jump since 2019
- Unplanned downtime across the Fortune Global 500 industrial companies studied adds up to roughly $1.4 trillion a year, or about 11% of revenue
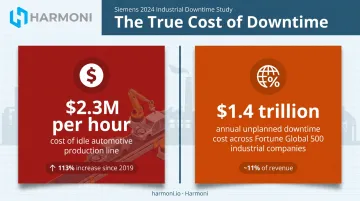
That's an automotive-sector figure, not a universal average. Still, it shows how fast downtime costs scale when nobody catches problems early.
Reactive Reporting vs. Real-Time Tracking
Most plants still report KPIs at the end of a shift or end of a day. That approach works, but it has a built-in flaw: by the time anyone reviews the numbers, the scrap has already been made and the deadline has already slipped.
McKinsey's research on discrete manufacturing found that 70% of surveyed manufacturers had launched Industry 4.0 pilots, but only 30% were capturing value at scale. Real-time performance tracking and in-line inspection were called out as high-value use cases still underused across the industry. The shift toward real-time visibility is underway. It just isn't evenly adopted yet.
Real-time tracking also exposes gaps that shift-end reports miss entirely:
- Execution gaps between what was planned and what actually happened, often traceable to a specific operator or machine. An operator might log full time on a job while the machine's spindle data shows extended idle periods
- Accurate job costing, since consistent KPI tracking captures true production time, actual labor usage, and scrap as it happens instead of relying on estimated hours and rough counts
The 4 Core Categories of Manufacturing KPIs
Most manufacturing KPIs fall into four practical buckets: quality, production, operational, and financial. This isn't an official industry standard. Organizations like NIST and LNS Research use broader groupings, but this four-part framework is a useful, editorial way to make sure your KPI program covers the full picture instead of over-indexing on one area.
A balanced program should include at least one KPI from each category.
Quality KPIs
These measure how closely your output matches specification. Common examples:
- Defect rate: the percentage of units that fail to meet quality standards
- First pass yield: units produced correctly without rework, on the first attempt
- Cost of poor quality: the total cost tied to scrap, rework, and warranty claims
Production KPIs
These measure how efficiently the shop floor converts available time into actual output. Common examples:
- Overall Equipment Effectiveness (OEE): the combined measure of availability, performance, and quality
- Cycle time: the actual time required to produce one unit
- Throughput: total units produced over a given period
- Downtime: time lost to breakdowns, changeovers, or unplanned stops
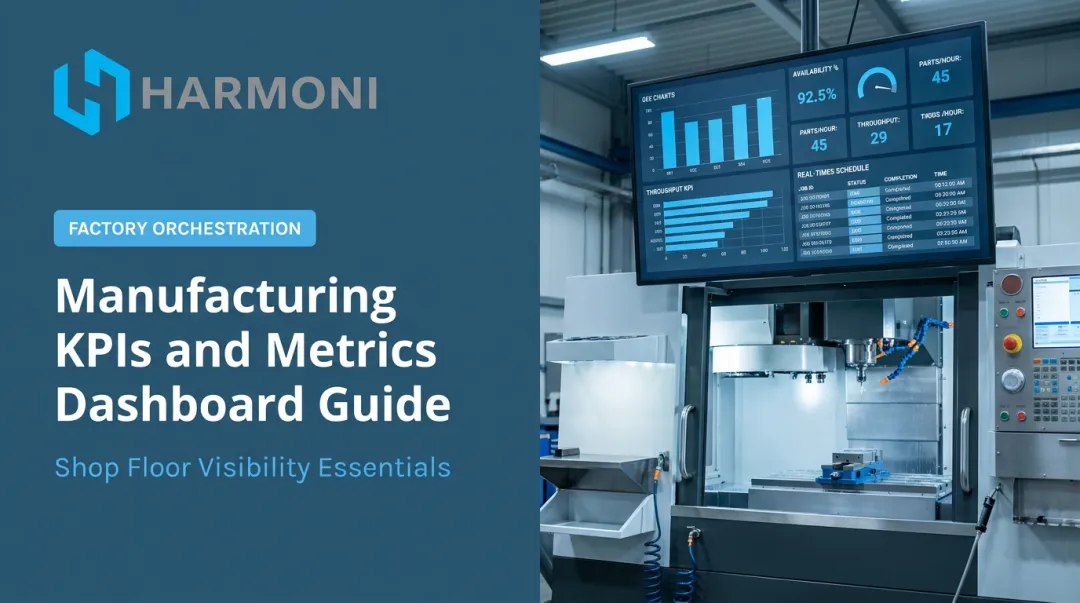
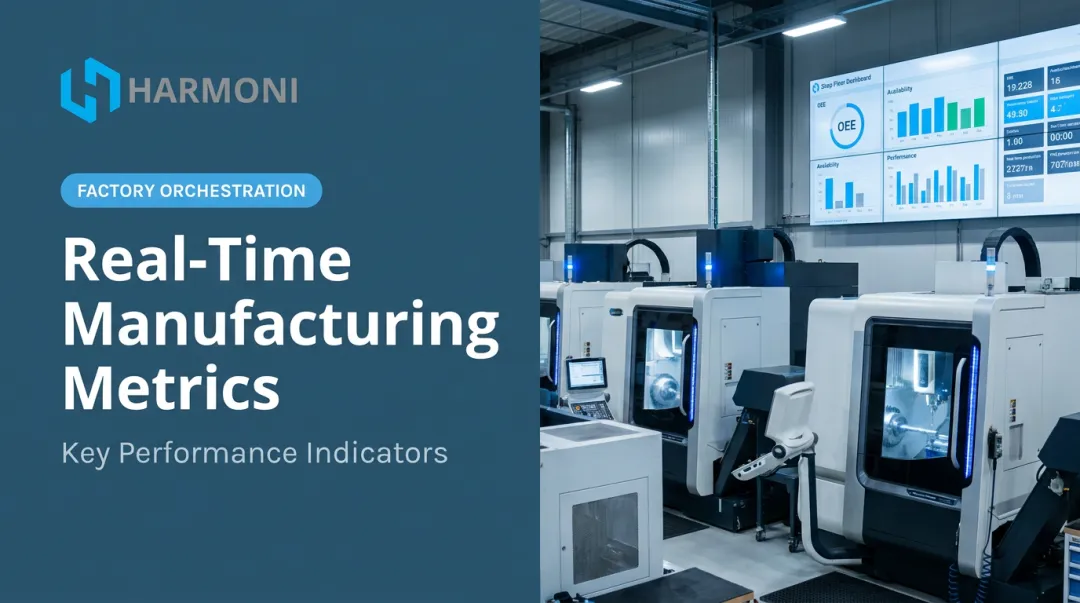
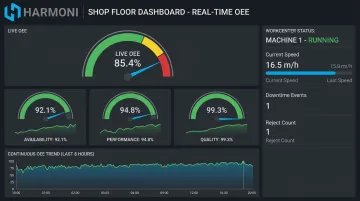
Platforms like Harmoni track OEE automatically, breaking down availability, performance, and quality contributions in real time, so teams see the metric as it happens rather than calculating it after the fact.
Operational KPIs
These measure how well supporting resources, beyond the machines themselves, are managed. Common examples:
- Capacity utilization: how much of available production capacity is actually being used
- Maintenance cost: spend on preventive and reactive maintenance relative to output
- Inventory turnover: how efficiently raw materials and WIP move through the plant
Financial KPIs
These translate floor-level performance into profitability. Common examples:
- Manufacturing cost per unit: total production cost divided by units produced
- Revenue per employee: a broad indicator of workforce productivity and efficiency
Top Manufacturing KPIs You Should Track
Dozens of KPIs exist across quality, production, operational, and financial categories. In practice, a focused set gives the clearest read on shop floor health without burying your team in reports nobody has time to review.
Overall Equipment Effectiveness (OEE)
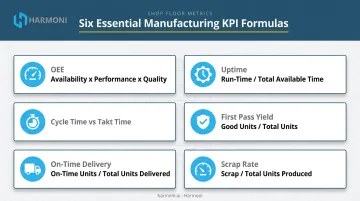
OEE is calculated as Availability × Performance × Quality, and it's widely treated as the benchmark KPI for equipment and line performance because it rolls three separate failure points into one number.
A 2021 manufacturing study cites above 85% OEE as a world-class benchmark, with component targets often set around 90% availability, 95% performance, and 99.9% quality. That said, OEE experts at Vorne caution there's no single ideal score for every operation. The right target is whatever number keeps driving sustained improvement in your specific environment. Platforms like Harmoni calculate OEE continuously from live machine data, removing the manual, shift-end logging that delays most tracking efforts.
Downtime and Uptime
Uptime is calculated as Run-Time ÷ Total Available Time. Downtime is simply the inverse: time the machine wasn't producing when it should have been.
Tracking downtime by cause, whether it's tooling changes, material shortages, or unplanned breakdowns, reveals exactly where bottlenecks and equipment issues are concentrated. A machine with 15% downtime tells you far less than a machine with 15% downtime split 10% material wait and 5% tooling failure.
Cycle Time and Takt Time
Cycle time is the actual time it takes to produce one unit. Takt time is the time available divided by customer demand: the pace you need to hit to keep up with orders.
Comparing the two reveals line balancing issues fast. If cycle time consistently exceeds takt time, you're falling behind demand. If it's well below takt time, you may have idle capacity you could redirect elsewhere.
First Pass Yield (FPY) / First Time Through (FTT)
The formula: Good Units ÷ Total Units Produced.
A declining FPY is an early warning sign. It usually points to one of three root causes: operator training gaps, tooling wear, or material inconsistency. Catching the decline early, rather than at month-end, gives you a real shot at correcting it before it snowballs into rework costs.
On-Time Delivery
The formula: On-Time Units Delivered ÷ Total Units Delivered.
This one connects directly to customer relationships. Missed ship dates don't just cost a single order, they erode the trust that keeps repeat business coming back. Aerospace and defense manufacturers commonly track OTD daily specifically to flag at-risk shipments before they slip.
Scrap Rate
The formula: Scrap ÷ Total Units Produced.
Tracking scrap rate by shift or by workcenter, rather than as one plant-wide number, pinpoints exactly where material waste originates. A scrap rate of 3% plant-wide might hide a single workcenter running at 12%, and that's the workcenter that needs attention first.
How to Choose the Right KPIs for Your Operation
Start with strategic goals, not a generic KPI list pulled from the internet. If your priority is cost reduction, capacity growth, or quality improvement, choose KPIs that directly measure progress toward that specific goal.
A few practical guardrails:
- Limit your actively tracked KPIs to a focused set (many manufacturers land around 8 to 10) to avoid data overload and diluted attention
- Assign one clear owner per KPI so accountability doesn't get lost between shifts
- Review operational KPIs (downtime, scrap) far more frequently than strategic ones (cost per unit)
Data quality matters as much as KPI selection. APQC's research on manufacturing measures found that only 38% of surveyed organizations considered their measures effective for decision-making. The most commonly cited problems were inconsistent measures across teams and inadequate data quality. Even a well-chosen KPI becomes misleading if the underlying numbers aren't captured consistently.
From Tracking to Action: Making KPI Data Work on the Shop Floor
Spreadsheets and end-of-shift reports have a fundamental limitation: by the time someone reviews the data, the scrap has already been produced, the delay has already happened, and the error has already shipped. Reporting after the fact tells you what went wrong. It doesn't help you stop it.
This is the gap real-time factory orchestration platforms like Harmoni are built to close. Harmoni combines machine data, operator activity, and ERP workflows into a single live view, giving managers a complete picture of what's happening on every machine as it happens rather than after a shift ends.
Capabilities That Improve KPI Accuracy
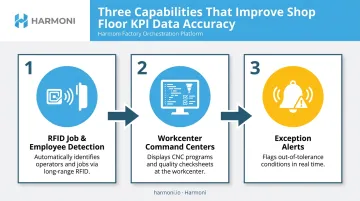
- RFID-based job and employee detection: instead of manual clock-ins at a remote kiosk, operators are automatically identified at the machine, pairing labor time directly with actual spindle activity
- Workcenter command centers: CNC programs, work instructions, and digital checksheets live at the machine itself, cutting the walking and searching that eats into productive time
- Exception alerts: when a cycle drifts out of tolerance or a job runs against the wrong revision, managers get flagged immediately, not at the next production meeting
This matters most for job costing. Harmoni ties actual machine cycle time, real labor hours, and scrap entries together at the point of production. The numbers feeding your KPIs reflect what actually happened, not an estimate from a standard time table.
That combination of machine spindle data and operator activity also surfaces gaps that traditional OEE tracking misses entirely, like an operator charging full time to a job while the machine sits idle.
If you want to see how this looks on an actual shop floor, Harmoni's demo walks through the RFID labor tracking and real-time dashboards directly.
Frequently Asked Questions
What is a KPI in manufacturing?
A manufacturing KPI is a measurable value tied to a specific business goal, used to track things like production efficiency, quality, and equipment performance. It differs from a plain metric because it's directly linked to a target.
What is an example of a KPI in manufacturing?
Overall Equipment Effectiveness (OEE) is one of the most common examples, combining availability, performance, and quality into a single score. Harmoni's real-time OEE tracking captures this automatically across machines and shifts, removing the need for manual data collection.
What is the difference between a KPI and a metric in manufacturing?
All KPIs are metrics, but not all metrics are KPIs. A metric is just a raw data point, like units produced. A KPI is one of the select few metrics tied directly to a strategic target.
How many KPIs should a manufacturer track?
Most operations find that limiting active tracking to around 8 to 10 critical measures keeps the focus actionable. Beyond that, teams tend to get buried in reports instead of acting on them.
What is the most important manufacturing KPI?
There's no single universal answer here. OEE, on-time delivery, and downtime are among the most commonly prioritized KPIs across industries, but the right priority depends on your specific goals.
How often should manufacturing KPIs be reviewed?
Operational KPIs like downtime and scrap are typically reviewed daily or per shift since they demand quick action. Strategic KPIs like cost per unit are usually reviewed less frequently, often monthly.